Decision Making


Workflow Diagram

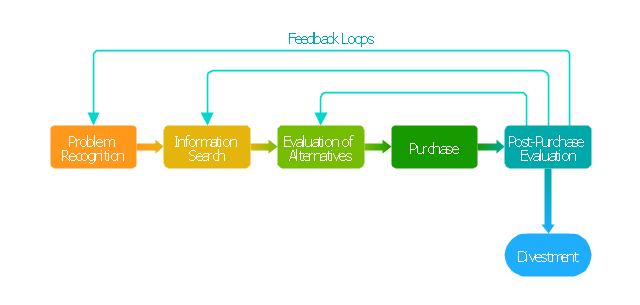
"Decision-making can be regarded as the cognitive process resulting in the selection of a belief and/ or a course of action among several alternative possibilities. Every decision-making process produces a final choice that may or may not prompt action. ...
Decision-making can also be regarded as a problem-solving activity terminated by a solution deemed to be satisfactory. It is, therefore, a reasoning or emotional process which can be rational or irrational and can be based on explicit assumptions or tacit assumptions. Most decisions are followed by some form of cost-benefit analysis. Rational choice theory encompasses the notion that people try to maximize benefits while minimizing costs.
Some have argued that most decisions are made unconsciously, if not involuntarily. Jim Nightingale, author of Think Smart – Act Smart, states that "we simply decide without thinking much about the decision process. ...
A major part of decision-making involves the analysis of a finite set of alternatives described in terms of evaluative criteria. Information overload occurs when there is a substantial gap between the capacity of information and the ways in which people may or can adapt."" [Decision-making. Wikipedia]
The block diagram example "Customer decision making" was created using the ConceptDraw PRO diagramming and vector drawing software extended with the Block Diagrams solution from the area "What is a Diagram" of ConceptDraw Solution Park.
Block diagram
Risk Analysis
SWOT Analysis Solution - Strategy Tools

SWOT Analysis Software

Root Cause Analysis

CORRECTIVE ACTIONS PLANNING. Risk Diagram (PDPC)

Relationships Analysis

Cause and Effect Analysis

Preventive Action

The Action Plan

 Management
This solution extends ConceptDraw DIAGRAM and ConceptDraw MINDMAP with Management Diagrams and Mind Maps (decision making, scheduling, thinking ideas, problem solving, business planning, company organizing, SWOT analysis, preparing and holding meetings
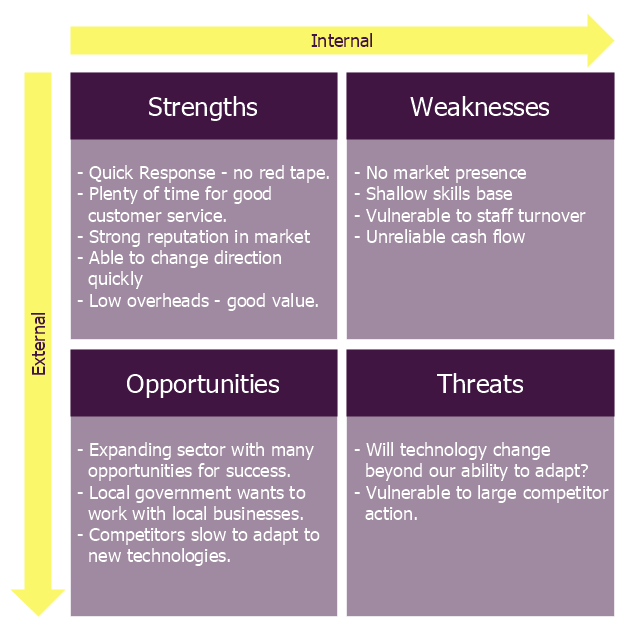
"The name says it: Strength, Weakness, Opportunity, Threat. A SWOT analysis guides you to identify the positives and negatives inside your organization (S-W) and outside of it, in the external environment (O-T). Developing a full awareness of your situation can help with both strategic planning and decision-making.
The SWOT method (which is sometimes called TOWS) was originally developed for business and industry, but it is equally useful in the work of community health and development, education, and even personal growth.
SWOT is not the only assessment technique you can use, but is one with a long track record of effectiveness. The strengths of this method are its simplicity and application to a variety of levels of operation." [ctb.ku.edu/ en/ table-of-contents/ assessment/ assessing-community-needs-and-resources/ swot-analysis/ main]
The diagram example "Small business consultancy SWOT analysis matrix" was created using the ConceptDraw PRO diagramming and vector drawing software extended with the SWOT Analysis solution from the Management area of ConceptDraw Solution Park.
SWOT matrix
PROBLEM ANALYSIS. Root Cause Analysis Tree Diagram

How to Create a PowerPoint Presentation from a SWOT Analysis Mindmap

PROBLEM ANALYSIS. Identify and Structure Factors

PROBLEM ANALYSIS. Prioritization Matrix

PROBLEM ANALYSIS. Relations Diagram

- Decision Making | PROBLEM ANALYSIS Prioritization Matrix | Risk ...
- Mind Maps for Business - SWOT Analysis | Decision Making ...
- Risk Analysis | The Action Plan | Decision Making | - Conceptdraw.com
- PROBLEM ANALYSIS Prioritization Matrix | Decision Making ...
- PROBLEM ANALYSIS Prioritization Matrix | Seven Management and ...
- Seven Management and Planning Tools | Decision Making ...
- Decision Making | Decision Making Software For Small Business ...
- Seven Management and Planning Tools | Decision Making ...
- Decision Making | Cross-Functional Flowchart | CORRECTIVE ...
- How To Make the Right Decision in Projects | Decision Making ...
- Project Task Trees and Dependencies | Decision Making ...
- Risk Analysis | CORRECTIVE ACTIONS PLANNING Risk Diagram ...
- PROBLEM ANALYSIS Prioritization Matrix | Corrective Action ...
- PROBLEM ANALYSIS Prioritization Matrix | The Action Plan ...
- Decision Making - Conceptdraw.com
- Decision Making | Block diagram - Customer decision making | Work ...
- Decision Making | Seven Management and Planning Tools | Marketing
- Seven Management and Planning Tools | Decision Making | The ...
- Seven Management and Planning Tools | Decision Making | The ...
- Seven Management and Planning Tools | Decision Making ...