 Total Quality Management TQM Diagrams
Total Quality Management Diagrams solution extends ConceptDraw PRO software with samples, templates and vector stencils library for drawing the TQM flowcharts.
 Seven Management and Planning Tools
Seven Management and Planning Tools solution extends ConceptDraw PRO and ConceptDraw MINDMAP with features, templates, samples and libraries of vector stencils for drawing management mind maps and diagrams.
 Fishbone Diagram
Fishbone Diagrams solution extends ConceptDraw PRO software with templates, samples and library of vector stencils for drawing the Ishikawa diagrams for cause and effect analysis.
Total Quality Management Value

 Business Productivity Area
Business Productivity Solutions extend ConceptDraw products with tools for making presentations, conducting meetings, preparing documents, brainstorming, or building new strategies.
 Event-driven Process Chain Diagrams
Event-driven Process Chain (EPC) Diagram is a type of flowchart widely used for modeling in business engineering and reengineering, business process improvement, and analysis. EPC method was developed within the Architecture of Integrated Information Systems (ARIS) framework.
Management Tools — Total Quality Management

Pyramid Diagram

 Management
This solution extends ConceptDraw PRO v9 and ConceptDraw MINDMAP v7 with Management Diagrams and Mind Maps (decision making, scheduling, thinking ideas, problem solving, business planning, company organizing, SWOT analysis, preparing and holding meetings
Total Quality Management with ConceptDraw
 method - Fishbone diagram template")
 ConceptDraw Solution Park
ConceptDraw Solution Park collects graphic extensions, examples and learning materials
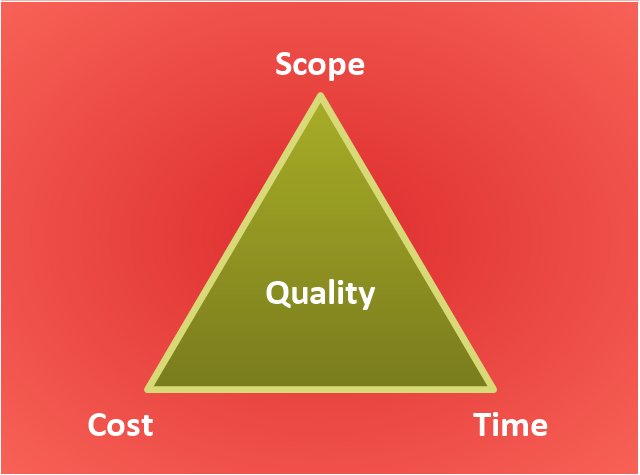
"The Project Management Triangle (called also Triple Constraint or the Iron Triangle) is a model of the constraints of project management. It is a graphic aid where the three attributes show on the corners of the triangle to show opposition. It is useful to help with intentionally choosing project biases, or analyzing the goals of a project. It is used to illustrate that project management success is measured by the project team's ability to manage the project, so that the expected results are produced while managing time and cost." [Project management triangle. Wikipedia]
The pyramid chart example "Project management triangle diagram" was redesigned using the ConceptDraw PRO diagramming and vector drawing software from Wikimedia Commons file Project-triangle-en.svg. [commons.wikimedia.org/ wiki/ File:Project-triangle-en.svg]
The project management triangle chart example is included in the Pyramid Diagrams solution from the Marketing area of ConceptDraw Solution Park.
Pyramid diagram
Network Diagrams for Bandwidth Management


TQM Diagram Tool

Total Quality Management Business Diagram

TQM Diagram — Professional Total Quality Management

TQM Software — Build Professional TQM Diagrams

Best Value — Total Quality Management

- Business Productivity Area | Total Quality Management Business ...
- Matrices | Seven Management and Planning Tools | SWOT analysis ...
- Seven Management and Planning Tools | Fishbone Diagram | Total ...
- Total Quality Management TQM Diagrams | TQM Software Build ...
- Marketing | Seven Management and Planning Tools | Entity ...
- Total Quality Management TQM Diagrams | TQM Diagram Tool ...
- Conceptdraw.com: Mind Map Software, Drawing Tools | Project ...
- Project management diagram
- Simple & Fast Diagram Software | Management Tools Total ...
- Seven Management and Planning Tools | Matrices | SWOT analysis ...
- Entity-Relationship Diagram (ERD) | Seven Management and ...
- Block diagram - Personal planning process | Seven Management ...
- TQM Diagram Tool | Mind Mapping in the Quality Management ...
- Seven Management and Planning Tools | Entity-Relationship ...
- Project timeline diagram
- GPS operation diagram | Network Diagrams for Bandwidth ...
- Total Quality Management TQM Diagrams | The Fifty Two Elements ...
- Definition TQM Diagram | Total Quality Management Definition ...
- Total Quality Management TQM Diagrams | TQM Diagram Example ...
- Seven Management and Planning Tools | Fishbone Diagram | Entity ...