This agile software development infographic example was designed on the base of the Wikimedia Commons file: NL-scrum.jpg. [commons.wikimedia.org/ wiki/ File:NL-scrum.jpg]
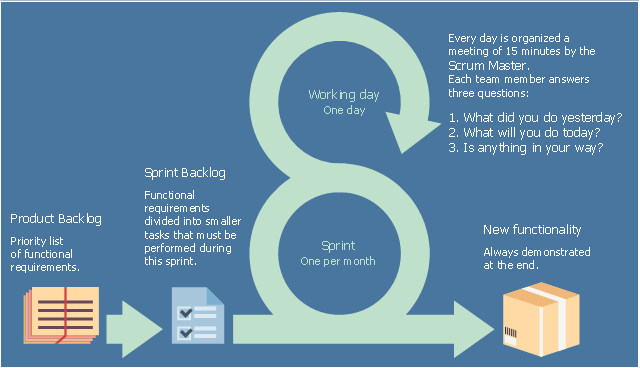
"Sprint
A time period (typically 1–4 weeks) in which development occurs on a set of backlog items that the team has committed to — commonly referred to as a time-box or iteration" [Scrum (software development). Wikipedia]
The infographic sample "Scrum sprint cycle" was created using the ConceptDraw PRO software extended with the Scrum solution from the Project Management area of ConceptDraw Solution Park.
Infographic
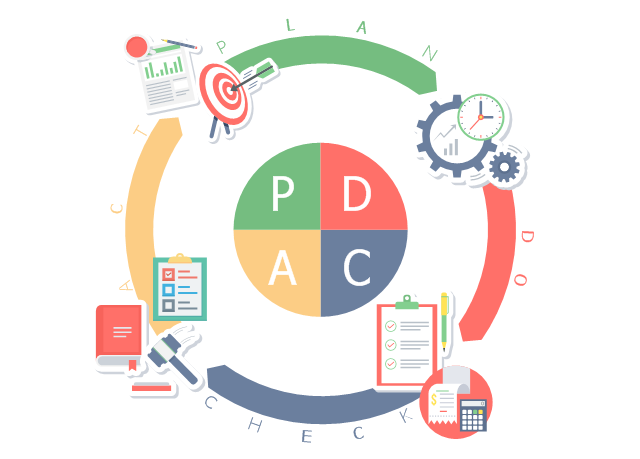
This business infographic sample shows the plan–do–check–act cycle. It was designed on the base of the Wikimedia Commons file: PDCA-Cycle.png.
[commons.wikimedia.org/ wiki/ File:PDCA-Cycle.png]
This file is licensed under the Creative Commons Attribution-Share Alike 3.0 Unported license. [creativecommons.org/ licenses/ by-sa/ 3.0/ deed.en]
"PDCA (plan–do–check–act or plan–do–check–adjust) is an iterative four-step management method used in business for the control and continual improvement of processes and products. It is also known as the Deming circle/ cycle/ wheel, Shewhart cycle, control circle/ cycle, or plan–do–study–act (PDSA)." [PDCA. Wikipedia]
The business infographic example "PDCA cycle" was designed using ConceptDraw PRO diagramming and vector drawing software extended with the Business and Finance solution from Illustration area of ConceptDraw Solution Park.
Infographic
Spatial infographics Design Elements: Location Map

Best Tool for Infographic Construction

Excellent Examples of Infographic Maps

Subway infographic design elements - software tools

Educational Technology Tools

How to draw Metro Map style infographics? (Los Angeles)

Geospatial Data

Winter Sports Vector Clipart. Medal Map. Spatial Infographics

How can you illustrate the weather condition

Biology Illustration

HelpDesk
How to Draw a Circular Arrows Diagram Using ConceptDraw PRO

How to Draw Pictorial Chart. How to Use Infograms

- Performance Management Cycle Infographic
- Kreb Cycle Infographic
- PDCA Cycle Infographic
- Scrum sprint cycle | Scrum workspace | Major sprint components ...
- Infographic Cycle Workflow
- Educational Materials | Make an Infographic | Education ...
- Scrum | Scrum Workflow | Scrum sprint cycle | Infographic Projects ...
- Content Marketing Infographics | Content marketing cycle - Ring ...
- Scrum sprint cycle | Scrum | Scrum board suggesting to use Kanban ...
- Design elements - Scrum artifacts | PM Agile | Scrum sprint cycle ...
- Scrum Workflow | PM Agile | Scrum sprint cycle | Agile Scrum Sprint
- Circle Arrow For Infographic Ppt
- PDCA cycle | Circular arrows diagram - PDCA cycle | Deming Cycle ...
- Scrum board suggesting to use Kanban | Scrum sprint cycle ...
- 3 Circle Venn. Venn Diagram Example | Best Tool for Infographic ...
- Atmosphere air composition | EU greenhouse gas emissions ...
- Circular arrows diagram - PDCA cycle
- Infographic Divided 5 With Arrows
- PDCA cycle | Attribution Wheel Diagram
- PDCA cycle | Basic Circular Arrows Diagrams | Think. Act ...