This agile software development infographic example was designed on the base of the Wikimedia Commons file: Simple-kanban-board-.jpg. [commons.wikimedia.org/ wiki/ File:Simple-kanban-board-.jpg]
This file is licensed under the Creative Commons Attribution-Share Alike 3.0 Unported license. [creativecommons.org/ licenses/ by-sa/ 3.0/ deed.en]
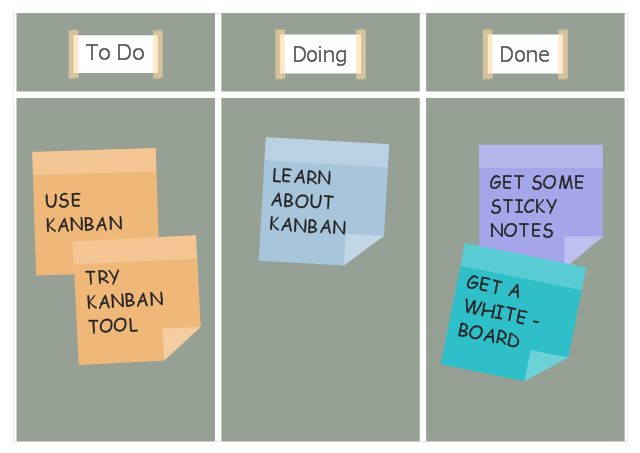
"The basic Scrumban board is composed out of three columns: To Do, Doing and Done. After the planning meeting the tasks are added to the To Do column, when a team member is ready to work on a task, he/ she moves it to the Doing column and when he/ she completes it, he/ she moves it to the Done column. The Scrumban board visually represents the progress of the team. The task board columns are adapted and expanded based on the team's work progress. The most common add-ons include priority columns in the To Do section and columns like Design, Manufacturing, Testing in the Doing section." [Scrumban. Wikipedia]
The infographic sample "Scrum board suggesting to use Kanban" was created using the ConceptDraw PRO software extended with the Scrum solution from the Project Management area of ConceptDraw Solution Park.
This file is licensed under the Creative Commons Attribution-Share Alike 3.0 Unported license. [creativecommons.org/ licenses/ by-sa/ 3.0/ deed.en]
"The basic Scrumban board is composed out of three columns: To Do, Doing and Done. After the planning meeting the tasks are added to the To Do column, when a team member is ready to work on a task, he/ she moves it to the Doing column and when he/ she completes it, he/ she moves it to the Done column. The Scrumban board visually represents the progress of the team. The task board columns are adapted and expanded based on the team's work progress. The most common add-ons include priority columns in the To Do section and columns like Design, Manufacturing, Testing in the Doing section." [Scrumban. Wikipedia]
The infographic sample "Scrum board suggesting to use Kanban" was created using the ConceptDraw PRO software extended with the Scrum solution from the Project Management area of ConceptDraw Solution Park.
Infographic
This agile software development infographic example was designed on the base of the Wikimedia Commons file: NL-scrum.jpg. [commons.wikimedia.org/ wiki/ File:NL-scrum.jpg]
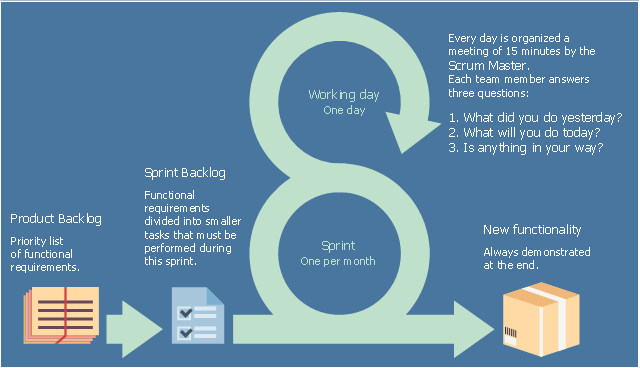
"Sprint
A time period (typically 1–4 weeks) in which development occurs on a set of backlog items that the team has committed to — commonly referred to as a time-box or iteration" [Scrum (software development). Wikipedia]
The infographic sample "Scrum sprint cycle" was created using the ConceptDraw PRO software extended with the Scrum solution from the Project Management area of ConceptDraw Solution Park.
Infographic
Kanban Board Software

 25 Typical Orgcharts
The 25 Typical Orgcharts solution contains powerful organizational structure and organizational management drawing tools, a variety of professionally designed organization chart and matrix organization structure samples, 25 templates based on various orga
Linux Audit Flowchart Example. Flowchart Examples

Use Case Diagrams technology with ConceptDraw PRO

Value stream with ConceptDraw PRO

 Organizational Charts
Organizational Charts solution extends ConceptDraw PRO software with samples, templates and library of vector stencils for drawing the org charts.
 People
This solution extends ConceptDraw PRO software with samples, templates and libraries of vector clipart for drawing the People illustrations. Use it to make professional-looking documents, presentations and websites illustrated with color scalable vector c
 Entity-Relationship Diagram (ERD)
An Entity-Relationship Diagram (ERD) is a visual presentation of entities and relationships. That type of diagrams is often used in the semi-structured or unstructured data in databases and information systems. At first glance ERD is similar to a flowch
 Spatial Infographics
Spatial infographics solution extends ConceptDraw PRO software with infographic samples, map templates and vector stencils libraries with design elements for drawing spatial information graphics.
- Business Board Org Chart | PM Agile | Scrum board | Visual ...
- Kanban Board Software | Scrum board | Business Board Org Chart ...
- Business Board Org Chart | PM Agile | Scrum board | Examples Of ...
- PM Agile | Ice Hockey Rink Dimensions | Business Board Org Chart ...
- Agile Org Chart Examples
- Kanban Board Software | Scrum board | Scrum process work items ...
- Kanban Board Software | Business Board Org Chart | ConceptDraw ...
- Kanban Board Software | Scrum board | Scrum Workflow | Kanban ...
- Project Timeline | Timeline Diagrams | Business diagrams & Org ...
- Business Board Org Chart | Kanban Board Software | ConceptDraw ...
- Kanban Board Software | Conceptual diagram of the Kanban ...
- Process Flowchart | Flowchart Software | Business diagrams & Org ...
- Cross-Functional Flowchart | Horizontal Org Flow Chart | Process ...
- Scrum board | Kanban Board Software | Scrum Workflow | Kanban ...
- PM Agile | Scrum Workflow | ConceptDraw Solution Park | Visual ...
- PM Agile | PM Docs | PM Meetings | Free Agile Project Management
- PM Agile | Scrum Workflow | Agile Methodology | Agile Project ...
- Scrum Workflow | Scrum | PM Agile | Project Management With Scrum
- Scrum | Scrum Workflow | Project Management Area | What Is Scrum ...