Program Evaluation and Review Technique (PERT) with ConceptDraw DIAGRAM
 with ConceptDraw DIAGRAM *")
PERT Chart Software

What is SWOT Analysis?

Best Software for Making Presentations

"Project planning is part of project management, which relates to the use of schedules such as Gantt charts to plan and subsequently report progress within the project environment.
Initially, the project scope is defined and the appropriate methods for completing the project are determined. Following this step, the durations for the various tasks necessary to complete the work are listed and grouped into a work breakdown structure. Project planning is often used to organize different areas of a project, including project plans, work loads and the management of teams and individuals. The logical dependencies between tasks are defined using an activity network diagram that enables identification of the critical path. Float or slack time in the schedule can be calculated using project management software. Then the necessary resources can be estimated and costs for each activity can be allocated to each resource, giving the total project cost. At this stage, the project schedule may be optimized to achieve the appropriate balance between resource usage and project duration to comply with the project objectives. Once established and agreed, the project schedule becomes what is known as the baseline schedule. Progress will be measured against the baseline schedule throughout the life of the project. Analyzing progress compared to the baseline schedule is known as earned value management.
The inputs of the project planning phase include the project charter and the concept proposal. The outputs of the project planning phase include the project requirements, the project schedule, and the project management plan." [Project planning. Wikipedia]
The flow chart example "Project planning process" was created using the ConceptDraw PRO diagramming and vector drawing software extended with the Flowcharts solution from the area "What is a Diagram" of ConceptDraw Solution Park.
Flowchart - Project planning process

 Timeline Diagrams
Timeline Diagrams solution extends ConceptDraw DIAGRAM diagramming software with samples, templates and libraries of specially developed smart vector design elements of timeline bars, time intervals, milestones, events, today marker, legend, and many other elements with custom properties, helpful for professional drawing clear and intuitive Timeline Diagrams. Use it to design simple Timeline Diagrams and designate only the main project stages, or highly detailed Timeline Diagrams depicting all project tasks, subtasks, milestones, deadlines, responsible persons and other description information, ideal for applying in presentations, reports, education materials, and other documentation.
 Seven Management and Planning Tools
Seven Management and Planning Tools solution extends ConceptDraw DIAGRAM and ConceptDraw MINDMAP with features, templates, samples and libraries of vector stencils for drawing management mind maps and diagrams.
Types of Flowcharts


Remote Projects in Corporate Strategy


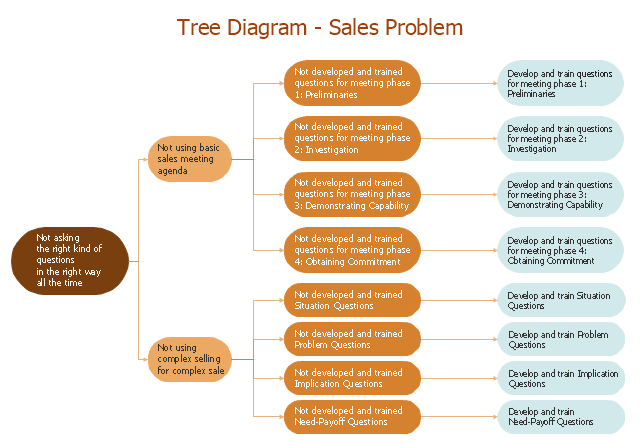
"Root cause analysis (RCA) is a method of problem solving that tries to identify the root causes of faults or problems. ...
RCA (in steps 3, 4 and 5) forms the most critical part of successful corrective action, because it directs the corrective action at the true root cause of the problem. Knowing the root cause is secondary to the goal of prevention, but without knowing the root cause, it is not possible to determine what an effective corrective action for the defined problem would be. ...
3. Ask "why" and identify the causes associated with each step in the sequence towards the defined problem or event. "Why" is taken to mean "What were the factors that directly resulted in the effect?"
4. Classify causes into causal factors that relate to an event in the sequence and root causes, that if eliminated, can be agreed to have interrupted that step of the sequence chain.
5. Identify all other harmful factors that have equal or better claim to be called "root causes." If there are multiple root causes, which is often the case, reveal those clearly for later optimum selection." [Root cause analysis. Wikipedia]
This root cause analysis (RCA) tree diagram example "Sale problem solution" was created using the ConceptDraw PRO diagramming and vector drawing software extended with the Seven Management and Planning Tools solution from the Management area of ConceptDraw Solution Park.
RCA diagram
Flowchart Definition

Basic Flowchart Symbols and Meaning


Mind Maps for Business - SWOT Analysis

UML Flowchart Symbols

SWOT matrix template

JSD - Jackson system development

SWOT analysis matrix diagram templates

Managing the task list

Concept Maps

- Critical Path Scheduling
- How to Use Critical Path Analysis for Scheduling Complex Projects ...
- Critical Path Method in ConceptDraw PROJECT | Export from ...
- How to Discover Critical Path on a Gantt Chart | Program Evaluation ...
- Critical Chain Project Management
- Critical Path Event Planning Templates
- Modelling Complex Events with Event-Driven Process chain | How ...
- Program Evaluation and Review Technique (PERT) with ...
- Porter's Value Chain | Deployment Chart Software | EPC - Business ...
- Porter's Value Chain | Logistics Flow Charts | EPC - Business ...
- Business process Flow Chart — Event-Driven Process chain (EPC ...
- Value Stream Mapping Symbols | Process Flowchart | EPC ...
- Porter's Value Chain | Superior Visio Import Works For Mac
- Gantt charts for planning and scheduling projects | Bar Diagrams for ...
- Marketing Flow Chart | Process Flowchart | Porter's Value Chain ...
- Matrices - Vector stencils library | Porter's value chain diagram ...
- Porter's Value Chain | SWOT analysis Software & Template for ...
- Porter's Value Chain | Process Flowchart | SWOT Analysis matrix ...
- Venn Diagram Template for Word | Donut Chart Templates | How to ...
- Mouse & Clicks | How to Perform Presentations in ConceptDraw ...