This site uses cookies. By continuing to browse the ConceptDraw site you are agreeing to our Use of Site Cookies.

How to Create a Scatter Chart

Simple tutorial help you learn how to draw a scatter chart and increase you possibilities of understanding and work more effective with our scatter chart software.
HelpDesk

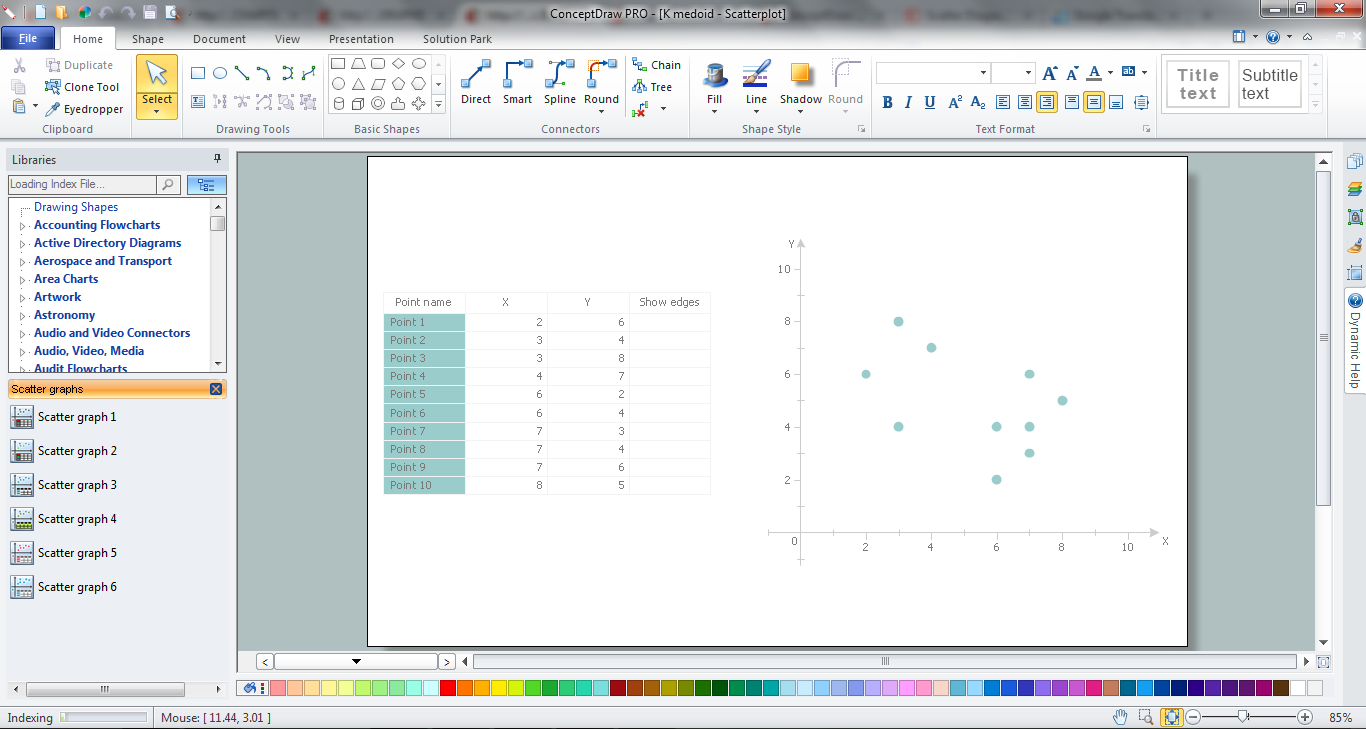
How to Draw a Scatter Diagram

Scatter Diagrams are used to visualize how a change in one variable affects another. A Scatter Diagram displays the data as a set of points in a coordinate system. It combines these values into single data points and displays them in uneven intervals. A Scatter Diagram can be very useful for identifying relationships between variables, for example, the relationship between price and quality rating. Making a Scatter Diagram involves many different elements that can be managed using ConceptDraw Scatter Diagram solution.

Blank Scatter Plot

This sample shows the Scatter Plot without missing categories. It’s very important to no miss the data, because this can have the grave negative consequences. The data on the Scatter Chart are represented as points with two values of variables in the Cartesian coordinates. This sample can be used in the engineering, business, statistics, analytics, at the creating the financial and other types of reports.

Scatter Chart

A Scatter Chart is a type of diagram which represents the data set as a collection of points in Cartesian coordinates. Each point is determined by the values of two variables. ConceptDraw DIAGRAM offers the Scatter Diagrams solution from the Graphs and Charts Area of ConceptDraw Solution Park. It's the best choice when you need create professional looking Scatter Chart.

Scatter Chart Examples

The Line Graphs solution from Graphs and Charts area of ConceptDraw Solution Park contains a set of examples, templates and design elements library of scatter charts.
Use it to draw scatter graphs using ConceptDraw DIAGRAM diagramming and vector drawing software for illustrating your documents, presentations and websites.

Scatter Plot

A scatter plot is also known to be called as a scatter graph, scatterplot, scatter chart, scatter diagram or scattergram. It is a type of a plot or mathematical diagram and to make it the Cartesian coordinates can be used for displaying the numeral values for usually two variables for one set of data.

Scatter Graph Charting Software

ConceptDraw provides some interactive xy chart and scatter graph symbols that offers advanced features yet is simple to use.

Line Graph Charting Software

To design line and scatter charts use ConceptDraw DIAGRAM diagramming and vector drawing software extended with Line Graphs solution from Graphs and Charts area of ConceptDraw DIAGRAM Solution Park. (Line chart, scatter chart, 2d chart).

Pyramid Diagram and Pyramid Chart

Pyramid Diagram is very useful to illustrate the foundation-based relationships. ConceptDraw DIAGRAM, a business charting software, includes some build-in symbols for designer to draw all kind of the pyramid diagrams.

Diagram of a Pyramid

Pyramid diagram is a convenient way of representing data hierarchical structure and visualization relationships between hierarchy levels. You need create the diagram of a pyramid? ConceptDraw diagramming and vector drawing software supplied with Pyramid Diagrams Solution from the Marketing Area of ConceptDraw Solution Park is the best tool for drawing attractive and successful diagram of a pyramid.

Bubble Chart

How to design a Bubble Chart? It’s very easy! All that you need is a powerful software. Never before creation of a Bubble Chart wasn’t so easy as now with tools of Bubble Diagrams Solution from the "Diagrams" Area for ConceptDraw Solution Park.

Polar Graph

This sample shows the Polar Graph. The Polar Graph is a graph in the polar coordinate system in which the each point on the plane is defined by two values - the polar angle and the polar radius. The certain equations have very complex graphs in the Cartesian coordinates, but the application of the polar coordinate system allows usually produce the simple Polar Graphs for these equations.

scatter chart, scatter graph, scatter plot Scatter Diagrams

scatter chart, scatter graph, scatter plot
The Scatter Diagrams solution extends ConceptDraw DIAGRAM functionality with templates, samples, and a library of vector stencils that make construction of a Scatter Plot easy. The Scatter Chart Solution makes it easy to design attractive Scatter Diagrams used in various fields of science, work, and life activities. ConceptDraw DIAGRAM lets you enter the data to the table and construct the Scatter Plot Graph automatically according to these data.

Chart Examples

Easy charting software comes with beautiful chart templates and examples. This makes it easy to create professional charts without prior experience.

Scatter Graph

You've got to draw the Scatter Graph and look for the convenient tool which will help you? Direct your attention on the ConceptDraw DIAGRAM diagramming and vector drawing software extended with Scatter Diagrams Solution from the Graphs and Charts Area.