Data Modeling Diagram

Banking System

 ATM UML Diagrams
The ATM UML Diagrams solution lets you create ATM solutions and UML examples. Use ConceptDraw DIAGRAM as a UML diagram creator to visualize a banking system.
Remote Learning Sessions - Webinars


Bank UML Diagram

Process with UML

Data Model

UML Use Case Diagram Example. Registration System

Credit Card Processing System UML Diagram

Design Elements for UML Diagrams

Design Elements for UML Diagrams
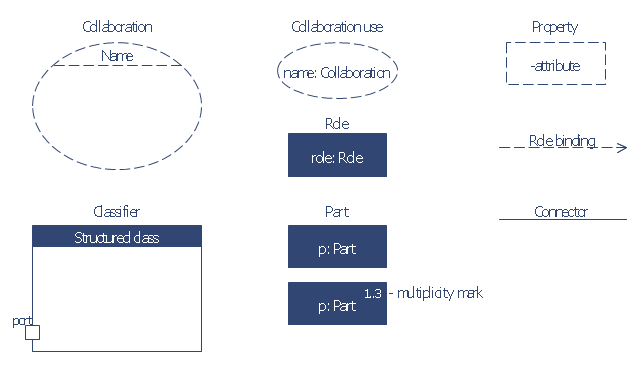
The vector stencils library "Bank UML composite structure diagram" contains 10 shapes for drawing UML composite structure diagrams.
Use it for object-oriented modeling of your bank information system.
"The key composite structure entities identified in the UML 2.0 specification are structured classifiers, parts, ports, connectors, and collaborations.
* Part : A part represents a role played at runtime by one instance of a classifier or by a collection of instances. The part may only name the role, it may name an abstract superclass, or it may name a specific concrete class. The part can include a multiplicity factor, such as the [0..*] shown for Viewer in the diagram.
* Port : A port is an interaction point that can be used to connect structured classifiers with their parts and with the environment. Ports can optionally specify the services they provide and the services they require from other parts of the system. In the diagram, each of the small squares is a port. Each port has a type and is labelled with a name... in the diagram. Ports may contain a multiplicity factor...
* Connector : A connector binds two or more entities together, allowing them to interact at runtime. The connector is shown as a line between some combination of parts, ports and structured classifiers. The diagram shows three connectors between ports, and one connector between a structured classifier and a part.
* Collaboration : A collaboration is generally more abstract than a structured classifier. It is shown as a dotted oval containing roles that instances can play in the collaboration.
* Structured classifier: A StructuredClassifier represents a class, often an abstract class, whose behavior can be completely or partially described through interactions between parts.
An EncapsulatedClassifier is a type of structured classifier that contains ports." [Composite structure diagram. Wikipedia]
This example of UML composite structure diagram symbols for the ConceptDraw PRO diagramming and vector drawing software is included in the ATM UML Diagrams solution from the Software Development area of ConceptDraw Solution Park.
UML composite structure diagram symbols
Create a Presentation Using a Design Template

UML Diagram Editor

UML Process Diagram Example

UML Class Diagram Example - Medical Shop

 Fishbone Diagrams
The Fishbone Diagrams solution extends ConceptDraw DIAGRAM software with the ability to easily draw the Fishbone Diagrams (Ishikawa Diagrams) to clearly see the cause and effect analysis and also problem solving. The vector graphic diagrams produced using this solution can be used in whitepapers, presentations, datasheets, posters, and published technical material.
UML Diagrams with ConceptDraw DIAGRAM

UML Tool & UML Diagram Examples

ER Diagram Programs for Mac

- Banking System Uml Diagram Free Download
- UML use case diagram - Banking system | How to Create a Bank ...
- UML in 10 mins | UML for Bank | UML Process Diagram Example ...
- Banking System
- Composite Structure Diagram For Banking System
- UML Diagram | Banking System | Bank System | Class Diagram For ...
- Bank System | Banking System | UML Use Case Diagram Example ...
- State Machine Diagram | UML Diagram | Design Elements for UML ...
- UML Diagram | Diagramming Software for Design UML Use Case ...
- Bank System | UML Activity Diagram | Banking System | Design ...
- UML Deployment Diagram Example - ATM System UML diagrams ...
- Bank System | UML Activity Diagram | Banking System | Design ...
- Symbols Core Banking System
- Bank Sequence Diagram | Bank UML Diagram | Banking System ...
- UML use case diagram - Banking system
- Use Case Diagrams For Bank Management
- UML Diagram | Process Flowchart | UML Activity Diagram | Control ...
- UML Diagram | Communication Diagram UML2.0 / Collaboration ...
- Bank System | Bank UML Diagram | Software Engineer Package ...
- Draw And Explain Object Diagram For Your Atm System