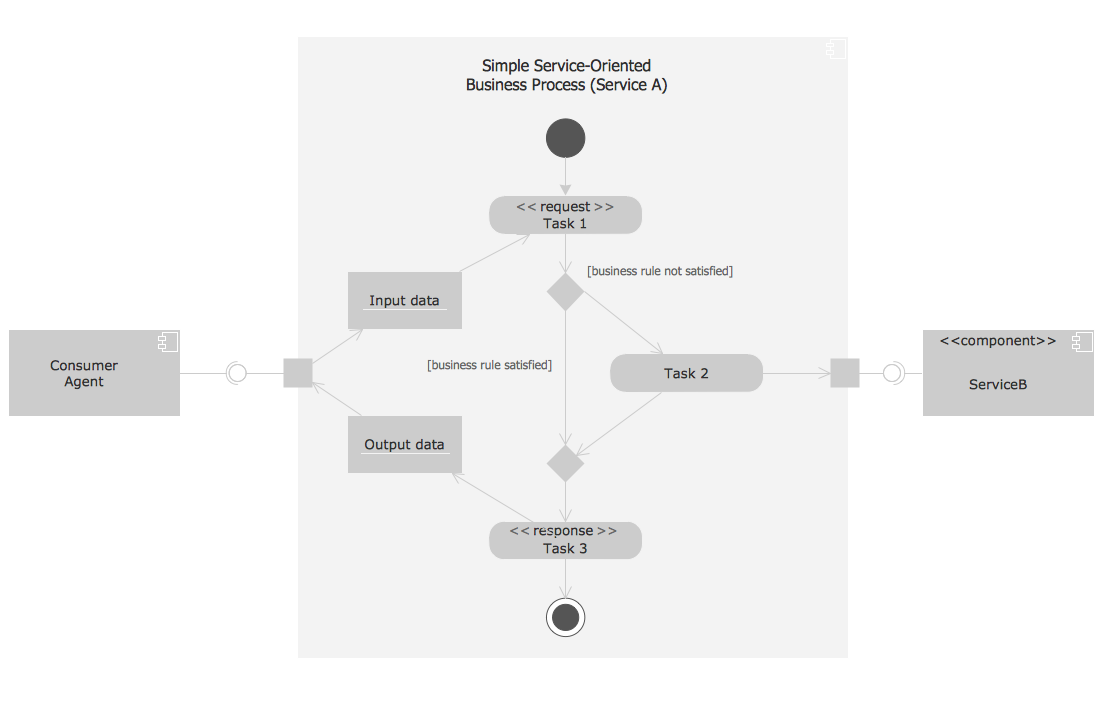
Pic. 1. Simple service-oriented business process with UML.
This UML activity diagram shows the abstract example of orchestration of service-oriented business process. Orchestration is the method for composition the hierarchical and self-contained service-oriented business processes. It is coordinated by the single agent.
Using the Rapid UML Solution for ConceptDraw DIAGRAM you can create your own professional UML Diagrams quick and easy.
All diagrams produced with ConceptDraw DIAGRAM are vector graphic documents and are available for reviewing, modifying, and converting to a variety of formats (image, HTML, PDF file, MS PowerPoint Presentation, Adobe Flash or MS Visio).
SEVEN RELATED HOW TO's:
Sequence Diagrams shows how objects communicate with each other in terms of a sequence of messages. Also indicates the lifespans of objects relative to those messages.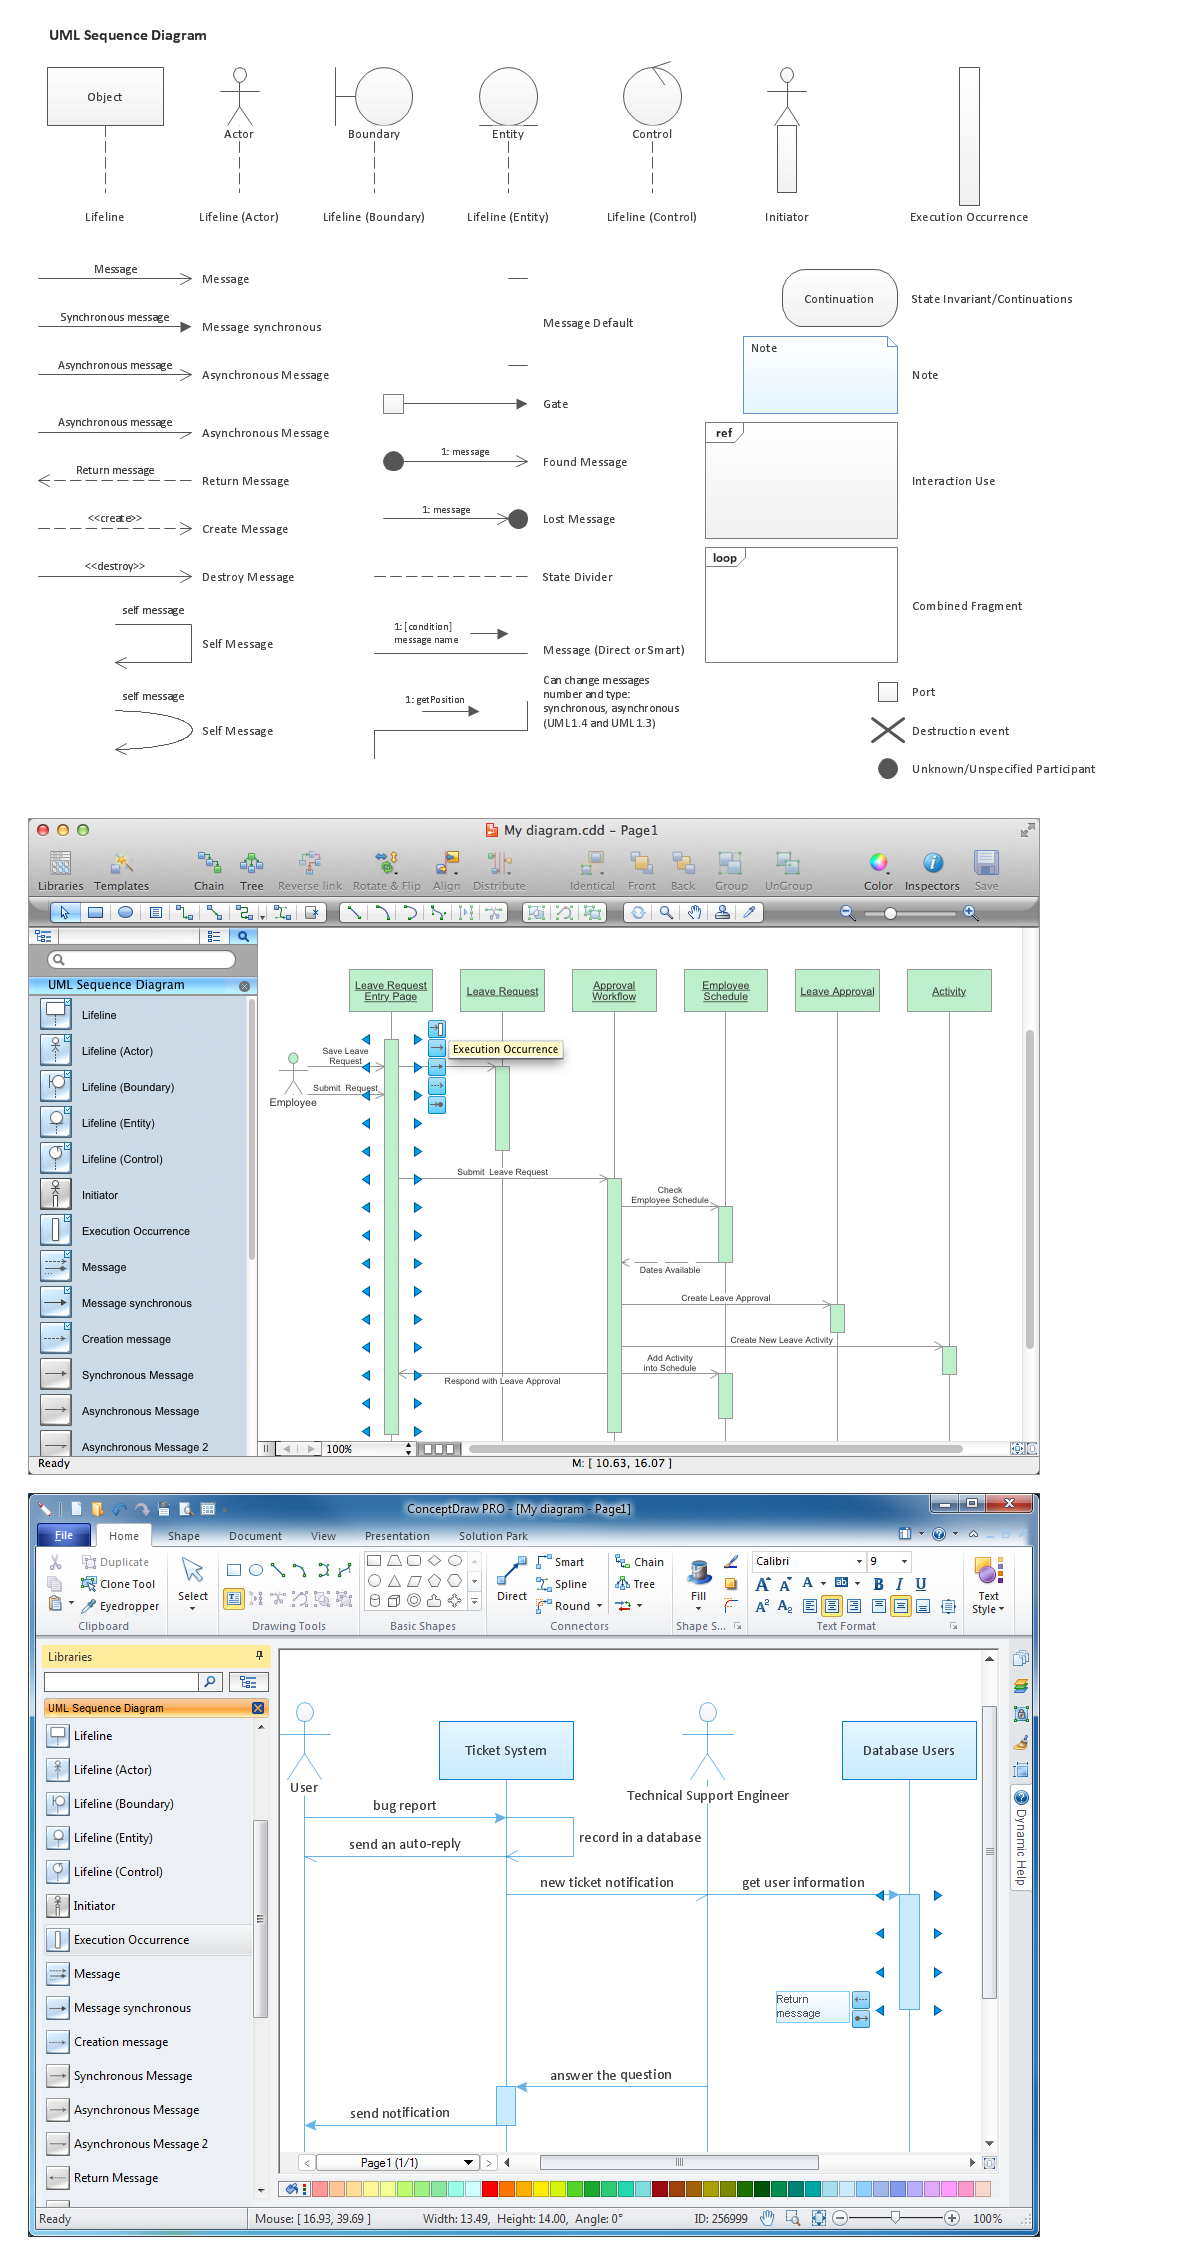
Picture: Diagramming Software for designing UML Sequence Diagrams
This sample was created in ConceptDraw DIAGRAM diagramming and vector drawing software using the UML Activity Diagram library of the Rapid UML Solution from the Software Development area of ConceptDraw Solution Park.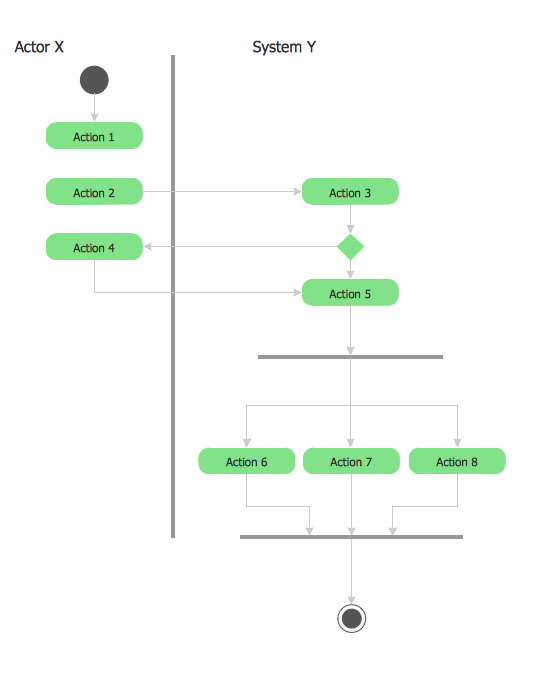
Picture: UML 2 4 Process Flow Diagram
Related Solution:
The Cloud Computing Architecture is the structure of the system, which is based on the needs of end-user and includes the set of components and subcomponents required for cloud computing, among them cloud resources, services, middleware, software components, front-end platforms (cloud clients), cloud-based back end platforms (servers, storage), and a network (Internet, Intranet, Intercloud). When designing the Cloud Computing Architecture diagrams, the ConceptDraw DIAGRAM diagramming and vector drawing software advises to turn attention for the powerful Cloud Computing Diagrams solution from the extensive Computers and Network area of ConceptDraw Solution Park.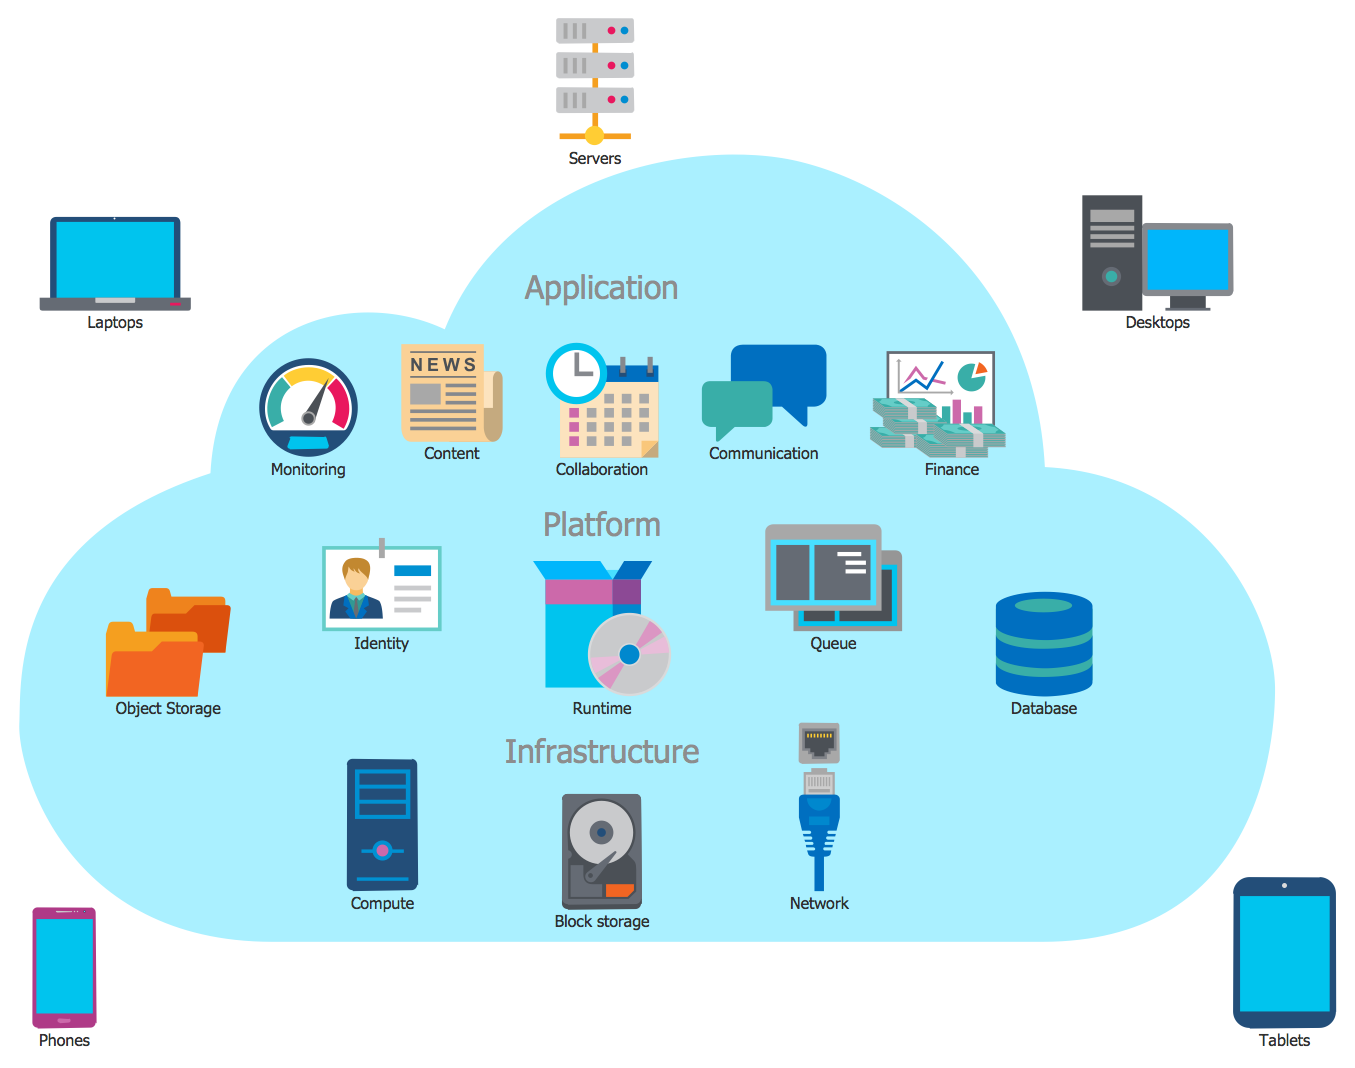
Picture: Cloud Computing Architecture
Related Solution:
Accounting is a cornerstone of any business, it’s basement. If you want to have a visual representation of your finance management, use audit flowchart symbols to document the money flow. Although some would say that accounting is boring, it is very a responsible duty.
The audit flowchart symbols is supplied with ConceptDraw Audit Flowcharts solution as a vector objects library. Together with Conceptdraw Drawing capabilities it forms the helpful tool for audit process planning and setting the steps of audit by designing audit flow charts. Audit Flow charts are used to organize fiscal information tracking process as well as in accounting, finance and investment management.
Picture: Audit Flowchart Symbols
Related Solution:
ConceptDraw - feature-rich flowchart software allows you create professional looking flowcharts.
Picture: Best Program to Create a Flowchart
Related Solution:
Biology solution offers 3 libraries of ready-to-use predesigned biology symbols and vector clipart to make your biology drawing and biology illustration making fast and easy: Carbohydrate Metabolism Library, Biochemistry of Metabolism Library, Citric Acid Cycle (TCA Cycle) Library.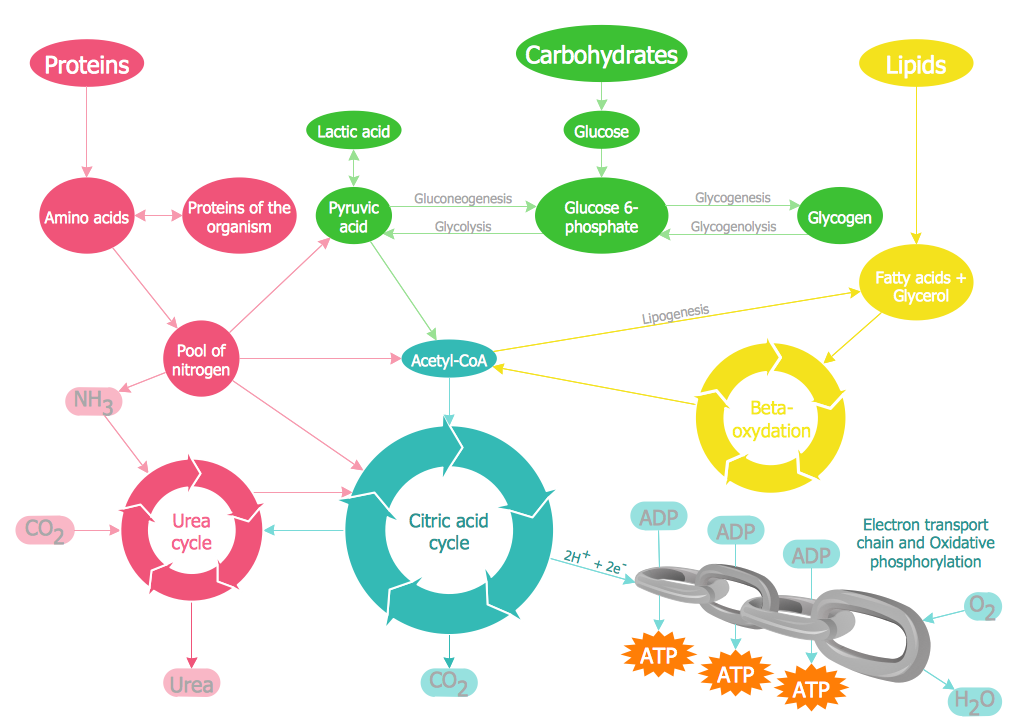
Picture: Biology Illustration
Related Solution:
Use Case Diagrams technology. IDEF4 standard implies not only graphical presentation but the additional information about diagrams of heredity, methods systematization and types which are contained in specifications.
Picture: IDEF4 Standard