HelpDesk
How to Draw a Gantt Chart Using ConceptDraw PRO

Process Flowchart


HelpDesk
How to Create an Interactive Voice Response (IVR) Diagram in ConceptDraw PRO
 diagram")
Activity on Node Network Diagramming Tool

This sample shows the Activity on node network diagramming method. It was created in ConceptDraw PRO diagramming and vector drawing software using the Seven Management and Planning Tools solution from the Management area of ConceptDraw Solution Park.
Amazon Web Services Diagrams diagramming tool for architecture

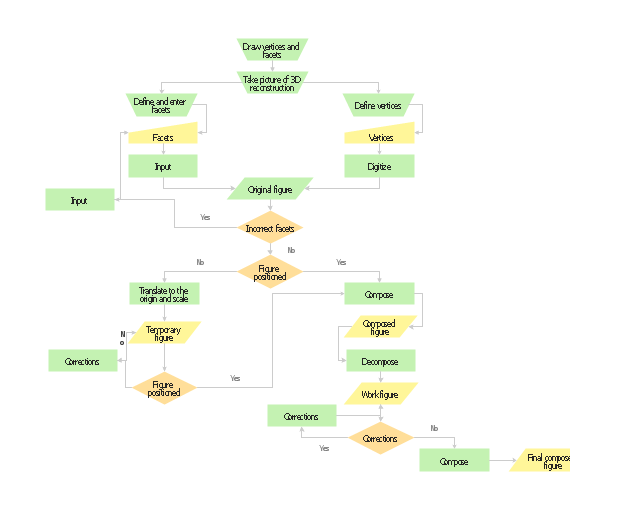
Planning scheme for the construction of a synthetic object.
"Computer-generated imagery (CGI) ... is the application of computer graphics to create or contribute to images in art, printed media, video games, films, television programs, commercials, and simulators. The visual scenes may be dynamic or static, and may be two-dimensional (2D), though the term "CGI" is most commonly used to refer to 3D computer graphics used for creating scenes or special effects in films and television." [Computer-generated imagery. Wikipedia]
The flow chart example "Synthetic object construction" was created using the ConceptDraw PRO diagramming and vector drawing software extended with the Flowcharts solution from the area "What is a Diagram" of ConceptDraw Solution Park.
Flowchart - Synthetic object construction
How To create Diagrams for Amazon Web Services architecture

HelpDesk
How to Create a Fishbone (Ishikawa) Diagram Quickly

 Plumbing and Piping Plans
Plumbing and Piping Plans solution extends ConceptDraw PRO v10.2.2 software with samples, templates and libraries of pipes, plumbing, and valves design elements for developing of water and plumbing systems, and for drawing Plumbing plan, Piping plan, PVC Pipe plan, PVC Pipe furniture plan, Plumbing layout plan, Plumbing floor plan, Half pipe plans, Pipe bender plans.
 Basic Diagramming
This solution extends ConceptDraw PRO software with the specific tools you need to easily draw flowcharts, block diagrams, histograms, pie charts, divided bar diagrams, line graphs, circular arrows diagrams, Venn diagrams, bubble diagrams and concept maps
Product Overview

 Fishbone Diagram
Fishbone Diagrams solution extends ConceptDraw PRO software with templates, samples and library of vector stencils for drawing the Ishikawa diagrams for cause and effect analysis.
Internet solutions with ConceptDraw PRO

 Accounting Flowcharts
Accounting Flowcharts solution extends ConceptDraw PRO software with templates, samples and library of vector stencils for drawing the accounting flow charts.
UML Diagram Types List

- Computer Generated Imagery Draw On Chart
- How to Draw a Flowchart | Process Flowchart | Flow Chart Diagram ...
- Synthetic object construction - Flowchart | Create a Flow Chart | How ...
- Mathematical Diagrams | Scientific Symbols Chart | How to Draw ...
- Flow Chart Of Computer Graphics
- Computer Flow Chart
- Process Flowchart | Create a Flow Chart | Example of Flowchart ...
- Process Flowchart | Flow Chart Diagram Examples | Create a Flow ...
- Synthetic object construction - Flowchart | Flow Chart Diagram ...
- Mechanical Engineering | How to Create a Mechanical Diagram ...
- Flow Chart Of Construction
- How To Prepare Chart For Applications Of Computer
- Computer Graphics All Programmes Flow Chart
- Proces Of Flow Chart Computer
- Mathematics Symbols | Scientific Symbols Chart | How to Draw ...
- Synthetic object construction - Flowchart | Process Flowchart | Flow ...
- Mechanical Drawing Symbols | Technical Drawing Software ...
- Drawing a Nature Scene | Beautiful Nature Scene: Drawing | Basic ...
- Flow Chart Diagram Examples | Example of Flowchart Diagram ...
- Algorithm Flow Chart Constructin
- ERD | Entity Relationship Diagrams, ERD Software for Mac and Win
- Flowchart | Basic Flowchart Symbols and Meaning
- Flowchart | Flowchart Design - Symbols, Shapes, Stencils and Icons
- Flowchart | Flow Chart Symbols
- Electrical | Electrical Drawing - Wiring and Circuits Schematics
- Flowchart | Common Flowchart Symbols
- Flowchart | Common Flowchart Symbols