The vector stencils library "Global networks" contains 63 computer and telecommunication icon symbols for drawing the global vehicular network diagrams.
"Satellite Internet access is Internet access provided through communications satellites. Modern satellite Internet service is typically provided to users through geostationary satellites that can offer high data speeds, with newer satellites achieving downstream data speeds up to 15 Mbps. ...
Satellite Internet generally relies on three primary components: a satellite in geostationary orbit (sometimes referred to as a geosynchronous Earth orbit, or GEO), a number of ground stations known as gateways that relay Internet data to and from the satellite via radio waves (microwave), and a VSAT (very-small-aperture terminal) dish antenna with a transceiver, located at the subscriber's premises. Other components of a satellite Internet system include a modem at the user end which links the user's network with the transceiver, and a centralized network operations center (NOC) for monitoring the entire system. Working in concert with a broadband gateway, the satellite operates a Star network topology where all network communication passes through the network's hub processor, which is at the center of the star. With this configuration, the number of remote VSATs that can be connected to the hub is virtually limitless." [Satellite Internet access. Wikipedia]
The clip art example "Global networks - Vector stencils library" was created using the ConceptDraw PRO diagramming and vector drawing software extended with the Vehicular Networking solution from the Computer and Networks area of ConceptDraw Solution Park.
www.conceptdraw.com/ solution-park/ vehicular-networking
City

Office Building

House

Radio Tower

Satellite Dish

International Space Station

Space Shuttle

Satellite

Satellite

Rocket

Airplane

Airplane

Airplane (back view)
-global-networks---vector-stencils-library.png--diagram-flowchart-example.png)
Airplane (back view)
-global-networks---vector-stencils-library.png--diagram-flowchart-example.png)
Helicopter

Helicopter

Helicopter (back view)
-global-networks---vector-stencils-library.png--diagram-flowchart-example.png)
Helicopter (back view)
-global-networks---vector-stencils-library.png--diagram-flowchart-example.png)
Car

Trailer

Double Decker Bus

High-speed Train

Freight Train

Regular Ship

Regular Ship

Passenger Vessel

Passenger Vessel

Battleship

Battleship

Submarine

Submarine

Bulk Carrier

Multipurpose Ship

Passanger Ship

Offshore Oil Platform

Eastern Hemisphere

Western Hemisphere

Eastern Hemisphere (oval)
-global-networks---vector-stencils-library.png--diagram-flowchart-example.png)
Western Hemisphere (oval)
-global-networks---vector-stencils-library.png--diagram-flowchart-example.png)
Eastern Hemisphere (oval)
-global-networks---vector-stencils-library.png--diagram-flowchart-example.png)
Western Hemisphere (oval)
-global-networks---vector-stencils-library.png--diagram-flowchart-example.png)
Orbit

Orbit (oval)
-global-networks---vector-stencils-library.png--diagram-flowchart-example.png)
Earth

Moon

Mars

World Map

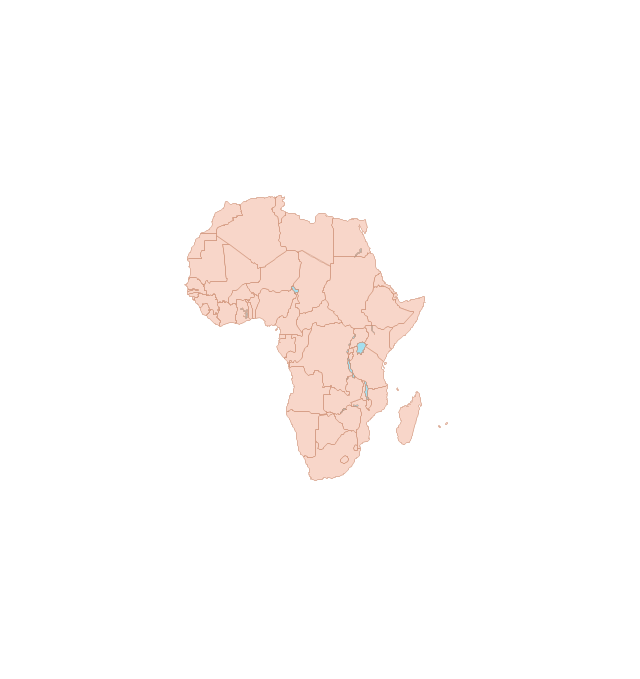
Africa
Central Asia

East Asia

Southern Asia

Middle East

Australia

Europe

Russia

South America

Central America

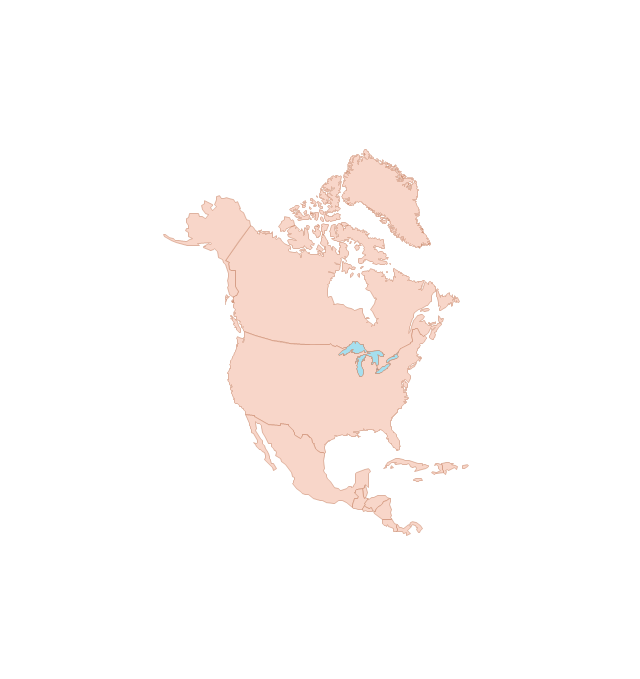
North America
Canada

USA

Circular Diagram

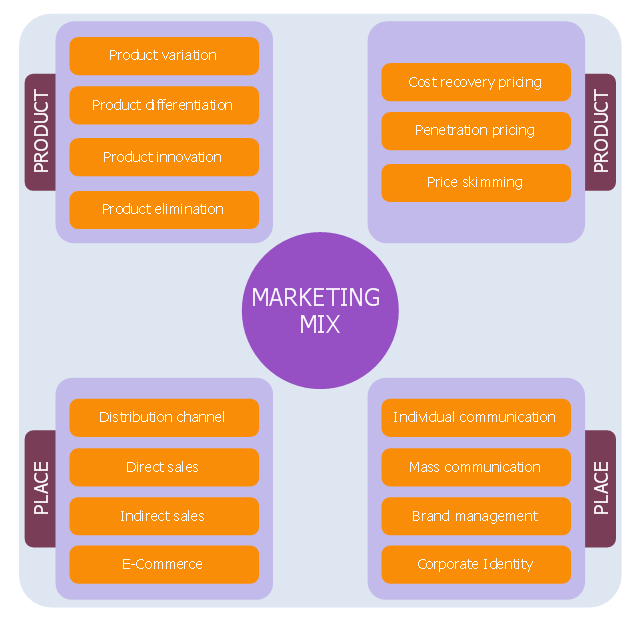
This diagram sample depicts marketing mix. It was designed on the base of the Wikimedia Commons file: Marketing-Mix (en).png.
[commons.wikimedia.org/ wiki/ File:Marketing-Mix_ %28en%29.png]
"The marketing mix is a business tool used in marketing and by marketeers . The marketing mix is often crucial when determining a product or brand's offer, and is often associated with the four P's: price, product, promotion, and place. In service marketing, however, the four Ps are expanded to the seven P's or eight P's to address the different nature of services.
In the 1990s, the concept of four C's was introduced as a more customer-driven replacement of four P's. There are two theories based on four Cs: Lauterborn's four Cs (consumer, cost, communication, convenience), and Shimizu's four Cs (commodity, cost, communication, channel).
In 2012, a new four P's theory was proposed with people, processes, programs, and performance." [Marketing mix. Wikipedia]
The chart example "Marketing mix diagram" was created using the ConceptDraw PRO diagramming and vector drawing software extended with the Marketing Diagrams solution from the Marketing area of ConceptDraw Solution Park.
Chart example
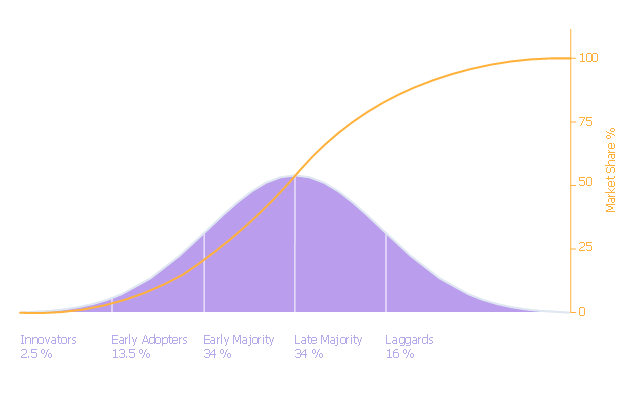
Diffusion of innovations (DOI) graph illustrates the diffusion of innovations theory.
"Diffusion of innovations is a theory that seeks to explain how, why, and at what rate new ideas and technology spread through cultures. Everett Rogers, a professor of communication studies, popularized the theory in his book Diffusion of Innovations... The book says that diffusion is the process by which an innovation is communicated through certain channels over time among the members of a social system. ... The book espouses the theory that there are four main elements that influence the spread of a new idea: the innovation, communication channels, time, and a social system. This process relies heavily on human capital. The innovation must be widely adopted in order to self-sustain. Within the rate of adoption, there is a point at which an innovation reaches critical mass. The categories of adopters are: innovators, early adopters, early majority, late majority, and laggards ... Diffusion of Innovations manifests itself in different ways in various cultures and fields and is highly subject to the type of adopters and innovation-decision process." [Diffusion of innovations. Wikipedia]
The marketing chart example "Diffusion of innovations graph" was created using the ConceptDraw PRO diagramming and vector drawing software extended with the Marketing Diagrams solution from the Marketing area of ConceptDraw Solution Park.
Marketing chart
Influence Diagram

Property Management Examples

Fishbone Problem Solving

Basic Circles Venn Diagram. Venn Diagram Example

HR Management Software

Exam Preparation Mind Map

Influence Diagram Software

Planogram Software and Retail Plan Software

Functional Organizational Structure

3 Circle Venn Diagram. Venn Diagram Example

UML Class Diagram Example - Buildings and Rooms

Chemistry Drawings

 Marketing Diagrams
Marketing Diagrams solution extends ConceptDraw DIAGRAM diagramming software with abundance of samples, templates and vector design elements intended for easy graphical visualization and drawing different types of Marketing diagrams and graphs, including Branding Strategies Diagram, Five Forces Model Diagram, Decision Tree Diagram, Puzzle Diagram, Step Diagram, Process Chart, Strategy Map, Funnel Diagram, Value Chain Diagram, Ladder of Customer Loyalty Diagram, Leaky Bucket Diagram, Promotional Mix Diagram, Service-Goods Continuum Diagram, Six Markets Model Diagram, Sources of Customer Satisfaction Diagram, etc. Analyze effectively the marketing activity of your company and apply the optimal marketing methods with ConceptDraw DIAGRAM software.
Cylinder Venn Diagram

Functional Block Diagram

Affinity Diagram Software

- Internet symbols - Vector stencils library | Communications - Vector ...
- Van Diagram Of Internet Computer And Communication
- Communication Skills Clipart
- Seo Vector Png
- Diffusion of innovations graph | Doi Chart
- Network Security Diagrams | Cloud Computing Diagrams ...
- Diffusion of innovations graph | Marketing Diagrams | Marketing ...
- Ladder of customer loyalty diagram | Marketing diagrams - Vector ...
- Diagram Of Diffusion Of Innovation Theory
- HR symbols - Vector stencils library | Company's organizational ...
- Diagram On Marketing Communication Mix
- Marketing mix - Wheel diagram | Marketing plan - Circular diagram ...
- Ladder of customer loyalty diagram | Loyalty - Arrow circle diagram ...
- Computers and Communications | Network Security Diagrams ...
- Basic CCTV System Diagram. CCTV Network Diagram Example ...
- Hybrid satellite and common carrier network diagram | Satellite ...
- Computers and network isometric - Vector stencils library | Venn ...
- Global networks - Vector stencils library | Vehicular Networking ...
- Digital Communications Network. Computer and Network Examples ...
- Relationship marketing | Venn diagram - Relationship marketing ...