Types of Welding in Flowchart

Entity Relationship Diagram Symbols

Account Flowchart. Flowchart Examples

Accounting Flowchart

Pyramid Diagram

Create Response Charts

Flow Chart Online

Flowcharting Software

Stakeholder Onion Diagrams

 Business Process Workflow Diagrams
The Business Process Workflow Diagrams solution enhances the ConceptDraw DIAGRAM functionality with predesigned examples, samples and a numerous collection of predesigned vector objects of workflow chart elements, icons, arrows, connectors, and varied wor
, t chart, decision matrix, decision tree analysis") Decision Making
Decision Making
The Decision Making solution offers the set of professionally developed examples, powerful drawing tools and a wide range of libraries with specific ready-made vector decision icons, decision pictograms, decision flowchart elements, decision tree icons, decision signs arrows, and callouts, allowing the decision maker (even without drawing and design skills) to easily construct Decision diagrams, Business decision maps, Decision flowcharts, Decision trees, Decision matrix, T Chart, Influence diagrams, which are powerful in questions of decision making, holding decision tree analysis and Analytic Hierarchy Process (AHP), visual decomposition the decision problem into hierarchy of easily comprehensible sub-problems and solving them without any efforts.
Pyramid Diagram and Pyramid Chart

ORM Diagram

IDEF9 Standard

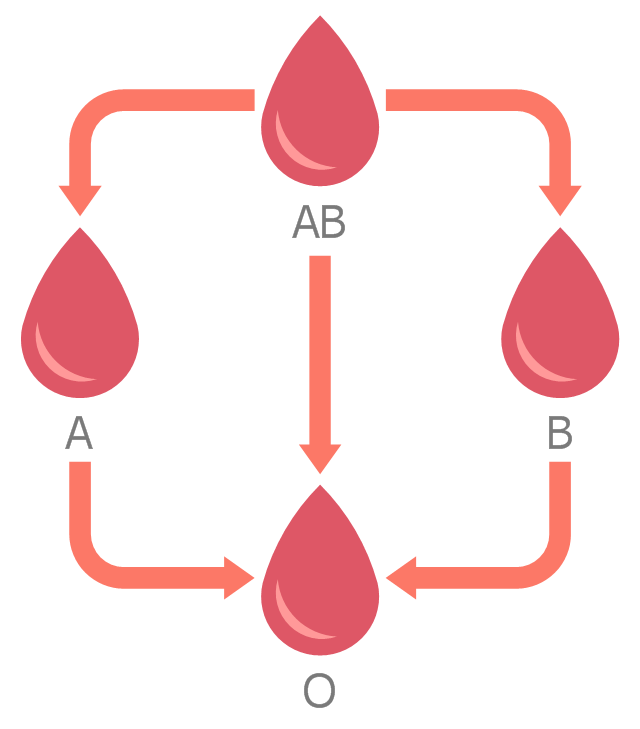
This medical flow chart sample depicts plasma donation compatibility path.
It was drawn on the base of Wikimedia Commons file: Plasma donation compatibility path.svg. [commons.wikimedia.org/ wiki/ File:Plasma_ donation_ compatibility_ path.svg]
This file is licensed under the Creative Commons Attribution-Share Alike 3.0 Unported license. [creativecommons.org/ licenses/ by-sa/ 3.0/ deed.en]
"A blood type (also called a blood group) is a classification of blood based on the presence and absence of antibodies and also based on the presence or absence of
inherited antigenic substances on the surface of red blood cells (RBCs). These antigens may be proteins, carbohydrates, glycoproteins, or glycolipids, depending on the blood group system. Some of these antigens are also present on the surface of other types of cells of various tissues. Several of these red blood cell surface antigens can stem from one allele (or an alternative version of a gene) and collectively form a blood group system. Blood types are inherited and represent contributions from both parents. A total of 35 human blood group systems are now recognized by the International Society of Blood Transfusion (ISBT). The two most important ones are ABO and the RhD antigen; they determine someone's blood type (A, B, AB and O, with +, − or Null denoting RhD status)." [Blood type. Wikipedia]
The medical flowchart example "Plasma donation compatibility path" was designed using ConceptDraw PRO software extended with Healthcare Workflow Diagrams solution from Business Processes area of ConceptDraw Solution Park.
Medical flowchart
Total Quality Management Business Diagram

UML Class Diagram Notation

HelpDesk
How To Design Regulatory Documents with use of Standard GHS Pictograms

Helpful in all stages of quality management

 Object-Role Modeling (ORM) Diagrams
Object-role Modeling (ORM) Diagram solution with powerful vector diagramming and data modeling tools, large quantity of specially developed samples and examples, and rich variety of vector objects corresponding to common ORM notation, ideally suits for developing the comprehensive, clear and visual Object-role Modeling (ORM) diagrams and schematics, understandable for all interested people from the different fields and business directions, for designing the ORM models, and demonstrating advantages from the use of ORM and its notation. It is intended for software developers and computer engineers, specialists in a field of Object-oriented programming (OOP), database architects, web-application constructors and developers, etc.
- Draw The Chart Showing The Classification Of Business Activity
- Draw A Chart Showing The Classification Of Business Activities
- Flowcharts | Draw A Chart To Show The Classification Of ...
- Types of Flowcharts | Flowchart on Bank. Flowchart Examples ...
- Draw The Chart Of Classification Of Business Activities With Examples
- Types of Flowcharts | Process Flowchart | Examples of Flowcharts ...
- Biology Drawing | Business Diagram Software | Flowchart For ...
- Process Flowchart | Types of Flowcharts | Flow chart Example ...
- Types of Flowchart - Overview | HR Flowchart Symbols | Process ...
- Computer Network Diagrams | Rapid UML | Draw A Diagram ...
- Classification Of Natural Resources With Flow Chart Pdf
- Draw The Classification Chart Of Computers
- Decision tree flowchart | Decision Making | Decision Tree Analysis ...
- | Prepare A Chat Showing Various Business Activities
- Types of Flowcharts | Accounting Flowchart Symbols | Drawing ...
- Draw The Classification Chart Of Computer
- Line Chart Examples | Create Flow Chart on Mac | Workflow ...
- Flow Chart On Classification Of Natural Resources With Eg
- Charts Of Commercial Activities
- Basic Flowchart Symbols and Meaning | Business Process ...