Pyramid Chart Examples
Pyramid Charts and Triangle Diagrams are used to visually structure the topics and progressively order the quantitative data. They allow to illustrate hierarchical structure of the topics, proportional, interconnected and containment relations among the topics. The multilevel Pyramids and Triangle diagrams are constructed oriented up or down and divided into several horizontal slices. They are effectively used to represent marketing strategies, social strategies, information systems, market value, etc., to illustrate presentations, websites, documents, reports in business, finances, sales, management, marketing, media, training, consulting, and many other fields. To maximize the efficiency in drawing the Pyramid Charts, use the ConceptDraw PRO diagramming and vector drawing software extended with Pyramid Diagrams solution from Marketing area, which contains the set of Pyramid Chart examples, samples, templates and vector design elements of triangular diagrams and pyramids with different quantity of levels for various needs.Risk Diagram (Process Decision Program Chart)
The risk is a probable event in result of which may occur the negative events and adverse consequences. The risk management is a very important process in any field, it is a process of making the management decisions aimed on the reducing the likelihood of appearing the unfavorable results and on the minimizing potential losses, as well as the implementation of these solutions. The main purpose of applying the risk management is increasing of enterprise's competitiveness with help of protection against the risks. ConceptDraw MINDMAP software is perfect for identifying the risks, analyzing and managing risks, for designing Risk Diagrams, for developing effective actions in response to circumstances and potential obstacles that were identified as risks. It is also the best for designing Process Decision Program Charts and representing the PDPC method, which is effective way of detailed planning and depiction the whole sequence of actions on the path from the formulation a problem to its solution. The PDPC lets determine the risks when corrective actions are not performed correctly and helps develop descriptions for preventive actions.Org Chart Diagram
ConceptDraw Office products and PM solutions included to ConceptDraw Solution Park support many project methodologies, among them Agile and Simple Projects, which help in implementing the best practices in project management. ConceptDraw Office applications give effective support in solving the issues related with planning, tracking, events, milestones, resource usage, and many other project management functions. ConceptDraw MINDMAP software provides the great advantages of a Mind Map hierarchical tree structure during the process of development the organizational structure of an organization. When you need to make the Organizational Chart, you can use any ConceptDraw PRO or ConceptDraw MINDMAP software. If you already have a designed Mind Map, it is incredibly easy to generate an Organizational Chart directly from ConceptDraw MINDMAP. You need simply double-click the corresponding icon, all the rest will be made automatically. The Organizational Chart will be created from the active page of your map, outputted to ConceptDraw PRO and opened in Slideshow mode.Types of Flowcharts
A Flowchart is a graphical representation of process, algorithm, workflow or step-by-step solution of the problem. It shows the steps as boxes of various kinds and connects them by arrows in a defined order depicting a flow. There are twelve main Flowchart types: Basic Flowchart, Business Process Modeling Diagram (BPMN), Cross Functional Flowchart, Data Flow Diagram (DFD), IDEF (Integrated DEFinition) Flowchart, Event-driven Process Chain (EPC) Diagram, Influence Diagram (ID), Swimlane Flowchart, Process Flow Diagram (PFD), Specification and Description Language (SDL) Diagram, Value Stream Mapping, Workflow Diagram. Using the Flowcharts solution from the Diagrams area of ConceptDraw Solution Park you can easy and quickly design a Flowchart of any of these types. This solution offers a lot of special predesigned vector symbols for each of these widely used notations. They will make the drawing process of Flowcharts much easier than ever. Pay also attention for the included collection of ready Flowchart examples, samples and quick-start templates. This is business process improvement tools. If you are looking for MS Visio for your Mac, then you are out of luck, because it hasn't been released yet. However, you can use Visio alternatives that can successfully replace its functions. ConceptDraw PRO is an alternative to MS Visio for Mac that provides powerful features and intuitive user interface for the same.
Pyramid Charts
ConceptDraw PRO extended with Pyramid Diagrams Solution from the Marketing Area of ConceptDraw Solution Park is a powerful Pyramid Charts making software. A Pyramid Chart has the form of triangle and hierarchically structures, organizes and help to analyze the information, data or ideas. Triangle is divided on the sections that usually have different widths. The width indicates the level of hierarchy among the topics.Gant Chart in Project Management
Gantt Chart is a graphical representation of tasks as segments on a time scale. It helps plan and monitor project development or resource allocation. There are list of tasks, project milesones and stages. The horizontal axis is a time scale, expressed either in absolute or relative time. Gantt chart can be used for planning in virtually any industry. There are major project planning tools using gantt chart for creating project plan. For instance, using ConceptDraw PROJECT together with ConceptDraw MINDMAP for planning marketing actions is very effective way. It makes ConceptDraw Office best marketing project management software for gantt chart planning marketing message, scheduling stages when to send massive text messages or when use email marketing services in specific projects. There are simple steps on how to use project management software for marketing, sales actions and product support. This is simple all in one toolbox for managers who need best project management software for small business as for planning and brainstorming as for reporting at project execution stage. Using gantt charts together with mindmap visuals and professional presentations charts make it excellent creative project management software. ConceptDraw PROJECT is portfolio project management software it allows manage many projects with multi gantt chart.
HelpDesk
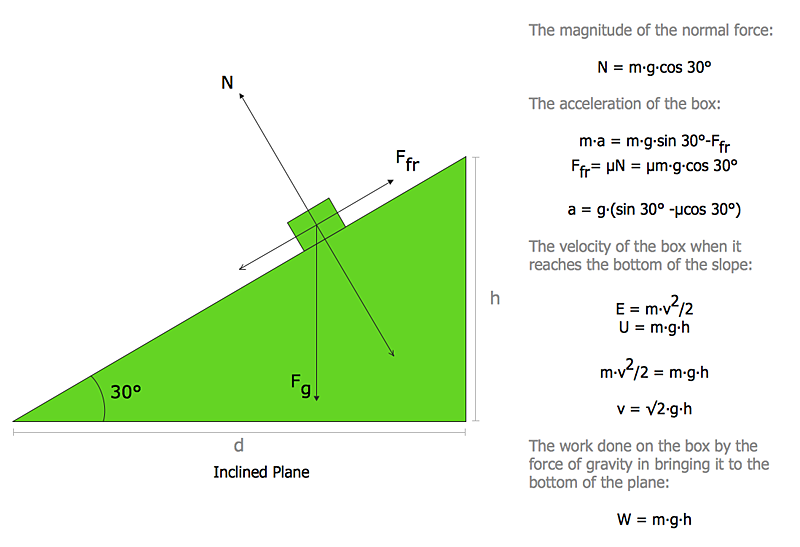
How to Draw Physics Diagrams in ConceptDraw PRO
Nothing is more helpful in the study of physics as a visual representation of the physical processes: physics schemes, diagrams and illustrations. Physics charts can be helpful when you learn Physics, perform experiments, or solve any other tasks regarding Physics. ConceptDraw PRO allows you to draw physical diagrams of mechanical, nuclear, optical and electrical processes using the set of vector physics symbols and physics diagram templates.What is Gantt Chart (historical reference)
Historical reference about the Gantt chart.
 Presentation Exchange
This solution extends ConceptDraw MINDMAP software with the ability to import presentations from Microsoft PowerPoint, as well as enhancing its existing presentation capabilities.
HelpDesk
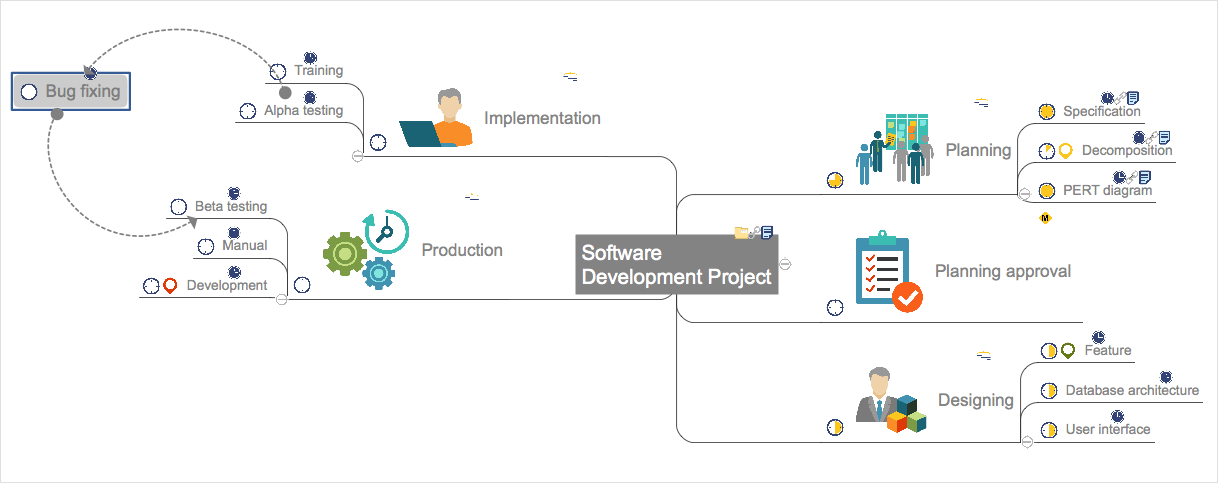
How to Create Floating Topics in a Mind Map
With ConceptDraw MINDMAP you have the ability to create floating topics that are not connected to the mind map structure. Since a floating topic is not connected to any other topics on the mind map, you can use it for future development of your main idea. This is a good way to make comments that relate to the entire map and not a separate topic.Pyramid Diagram and Pyramid Chart
Pyramid Diagram, Triangle Chart or Triangular Diagram is a convenient and useful type of diagrams, which lets represent the data hierarchical structure and to illustrate the foundation-based relationships between the hierarchy levels. Pyramid Diagrams are used to visualize effectively the hierarchical, as well as proportional and foundation-based relationships, the process steps, the interconnections of organizational layers or topics. ConceptDraw PRO software enhanced with Pyramid Diagrams solution from Marketing area of ConceptDraw Solution Park is a powerful business charting software, that includes all required tools for designing the multilevel Pyramid Diagrams as quickly as possible. The build-in vector stencils and templates are the great aid for designers, a variety of examples and samples is a good base and source of inspiration. Use attractive and vivid 2D and 3D Pyramid Diagrams and Triangle Charts designed in ConceptDraw PRO to illustrate your documents, presentations, infographics, articles, reports, websites, etc.Local area network (LAN). Computer and Network Examples
Local Area Network (LAN) is a network which consists of computers and peripheral devices connected each other and to the local domain server, and covers a little territory or small number of buildings, such as home, school, laboratory, office, etc. LAN serves for few hundreds of users. It includes many cables and wires, and demands to design previously a Network diagram. All local area network devices can use the shared printers and disk storage. ConceptDraw PRO is a perfect network diagramming software with examples of LAN Diagrams, templates and predesigned vector objects. ConceptDraw PRO is the ideal choice for network engineers and network designers who need to draw fast and easy Local Area Network Diagrams, for IT specialists, developers and other IT professionals which need to visualize the communication schemes of LAN and visually document the LAN's physical structure and arrangement in houses, offices and other buildings. Ready-to-use vector objects from Computer Network Diagrams solution will help you design LAN diagrams in minutes.
Bubble Chart
How to design a Bubble Chart? It’s very easy! All that you need is a powerful software. Never before creation of a Bubble Chart wasn’t so easy as now with tools of Bubble Diagrams Solution from the "Diagrams" Area for ConceptDraw Solution Park.Skype Presentation
How to do Skype Presentation. Solution for ConceptDraw Mindmap- Any Bio Topic Flowchart
- Flow Chart Related To Mathematics On Any Topic
- In Chemistry Any Topic With Digram Give Chart
- Chemistry Chart For Any Topic
- Chemistry Any Chart
- Draw A Chart On Any Topic Of Chemistry
- Educational Chart In The Topic Drawing
- Accounting Flowcharts | Chart Of Any Topic Of Accountancy
- Process Flowchart | Bio Flowchart Lite | How To Create a Bubble ...
- Flow Chart Of Science Topic
- Topics For Drawing Chart In Chemistry
- Chart On Any Chemistry Topic
- Chemistry Chart Topics
- Chemistry Chart Topic Image
- Easy Flow Chart Models For Mathematics Topic
- Physics Diagrams | | Flow Chart Of Maths Topic
- How to Draw Chemistry Structures | Bio Flowchart Lite | Chemistry ...
- Physics Topic With Chart
- Best Physics Diagram In All Topics
- Best Topic In Chemistry For Chart Daigram


