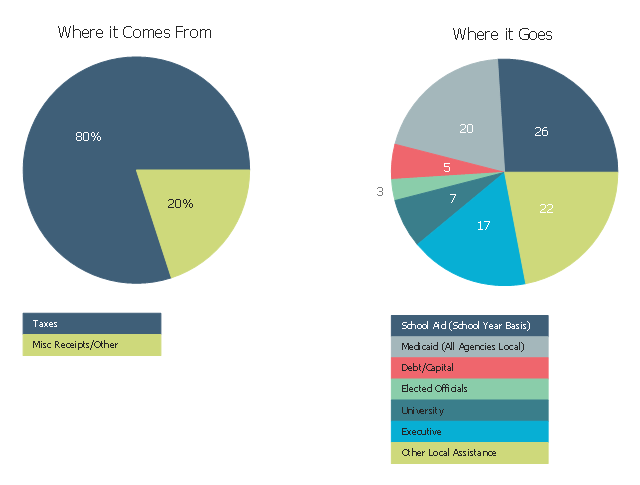
These pie chart samples show where New York’s budget dollars come from and how taxpayer money is being spent.
They was designed on the base of donut charts from the New York State Open Budget website.
"State Operating Funds: The State Funds operating budget comprises the General Fund and other State-supported activities financed by dedicated revenues in State Special Revenue funds, as well as Debt Service funds accounting for the payment of debt service on all tax-financed State long-term debt. All capital spending, regardless of financing source, is included in the Capital budget." [openbudget.ny.gov/ overview.html]
The donut chart example "State operating funds" was created using the ConceptDraw PRO diagramming and vector drawing software extended with the Pie Charts solutiton of the Graphs and Charts area in ConceptDraw Solution Park.
Donut chart
 Pie Charts
Pie Charts are extensively used in statistics and business for explaining data and work results, in mass media for comparison (i.e. to visualize the percentage for the parts of one total), and in many other fields. The Pie Charts solution for ConceptDraw PRO v10 offers powerful drawing tools, varied templates, samples, and a library of vector stencils for simple construction and design of Pie Charts, Donut Chart, and Pie Graph Worksheets.
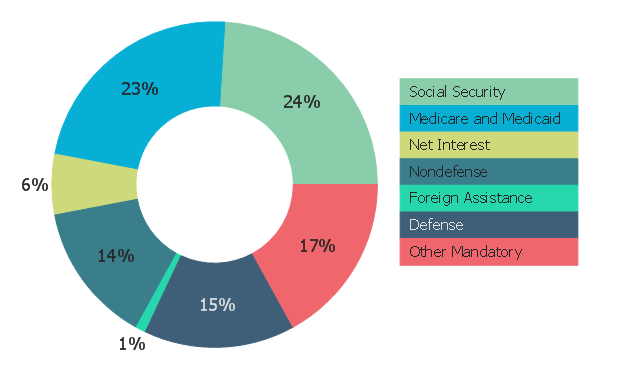
This doughnut chart sample shows the major categories of U.S. federal spending. It was designed on the base of the donut chart from the website ForeignAssistance.gov. [beta.foreignassistance.gov/ images/ learn/ FederalSpending_ piechart.png]
"The United States of America is a federal republic with separate state and local governments. Taxes are imposed in the United States at each of these levels. These include taxes on income, payroll, property, sales, capital gains, dividends, imports, estates and gifts, as well as various fees." [Taxation in the United States. Wikipedia]
The donut chart example "Major categories of federal spending" was created using the ConceptDraw PRO diagramming and vector drawing software extended with the Pie Charts solution of the Graphs and Charts area in
ConceptDraw Solution Park.
Donut chart
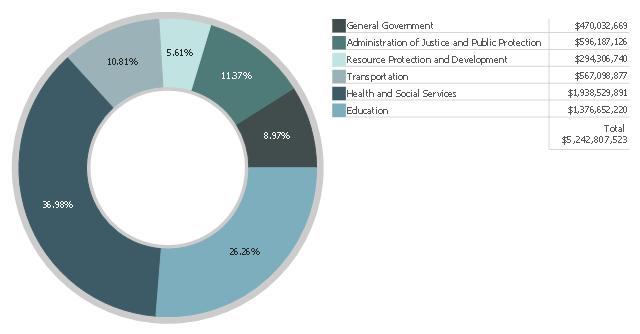
This donut chart example shows the citizens and taxpayers of New Hampshire how the State of New Hampshire spends their money they pay for their government. It depicts how the New Hampshire's FY2014 Authorized Budget as enacted is allocated to the six categories of government.
The doughnut chart example "Budgeted appropriations" was designed on the base of the graph from the official website of New Hampshire government. [www.nh.gov/ transparentnh/ where-the-money-goes/ ].
"Authorization and appropriations.
In general, funds for federal government programs must be authorized by an "authorizing committee" through enactment of legislation. Then, through subsequent acts by Congress, budget authority is then appropriated by the Appropriations Committee of the House. In principle, committees with jurisdiction to authorize programs make policy decisions, while the Appropriations Committees decide on funding levels, limited to a program's authorized funding level, though the amount may be any amount less than the limit.
The budget resolutions specify funding levels for the House and Senate Appropriations Committees and their 12 subcommittees, establishing various budget totals, allocations, entitlements, and may include reconciliation instructions to designated House or Senate committees. The appropriations committees, starting with allocations in the budget resolution, draft appropriations bills, which may be considered in the House after May 15. Once appropriations committees pass their bills, they are considered by the House and Senate. When there is a final budget, the spending available to each appropriations committee for the coming fiscal year is usually provided in the joint explanatory statement included in the conference report. The appropriations committees then allocate that amount among their respective subcommittees, each to allocate the funds they control among the programs within their jurisdiction." [United States budget process. Wikipedia]
The donut chart example "Budgeted appropriations" is created using the ConceptDraw PRO diagramming and vector drawing software extended with the Pie Charts solution of the Graphs and Charts area in ConceptDraw Solution Park.
Donut chart
Draw Company Structure with Organization Charting Software

Draw Company Structure Diagram - get the detailed information about the company structure and hierarchy - who execute what tasks and who is in charge at this company. This information shows the reasoning and success of business and is indispensable for investors and financial institutions.
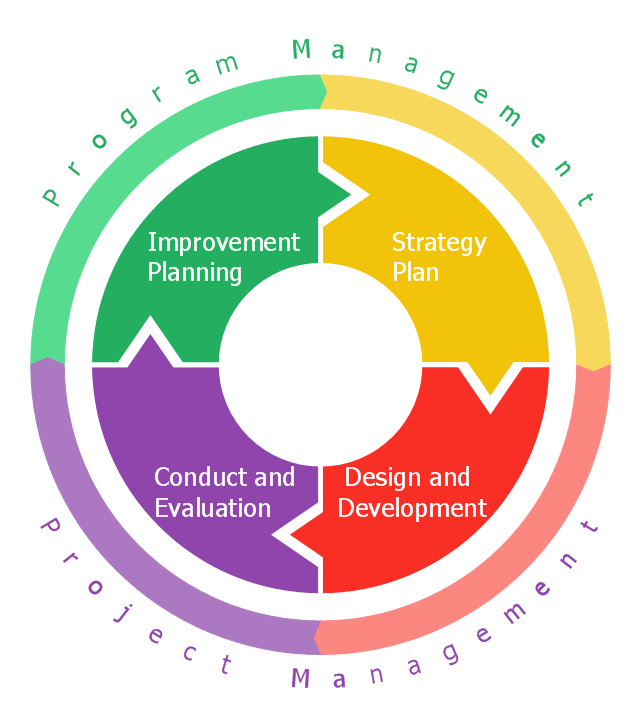
This circular arrows diagram sample shows the exercise cycle stages: 1) Strategy plan, 2) Design and development, 3) Conduct and evaluation, 4) Improvement planning. It was designed on the base of the diagram on the Emergency Management Insitute training IS-120.b webpage from the website of the Federal Emergency Management Agency (FEMA) of the United States Department of Homeland Security.
[emilms.fema.gov/ IS120A/ summary.htm]
"Exercises give communities, states, and regions a set of essential tools to prevent, prepare for, respond to, and recover from disasters." [emilms.fema.gov/ IS120A/ module0.htm]
"Disaster management (or emergency management) is the creation of plans through which communities reduce vulnerability to hazards and cope with disasters. Disaster management does not avert or eliminate the threats; instead, it focuses on creating plans to decrease the effect of disasters. Failure to create a plan could lead to human mortality, lost revenue, and damage to assets. Currently in the United States 60 percent of businesses do not have emergency management plans. Events covered by disaster management include acts of terrorism, industrial sabotage, fire, natural disasters (such as earthquakes, hurricanes, etc.), public disorder, industrial accidents, and communication failures." [Emergency management. Wikipedia]
The diagram example "Emergency management exercise cycle" was created using the ConceptDraw PRO diagramming and vector drawing software extended with the Circular Arrows Diagrams solution from the area "What is a Diagram" of ConceptDraw Solution Park.
Circular arrows diagram
Rainfall Bar Chart

How to do presentation of Mind Maps via Skype conference call?

Waterfall Bar Chart

Chart Software for Better Presentations

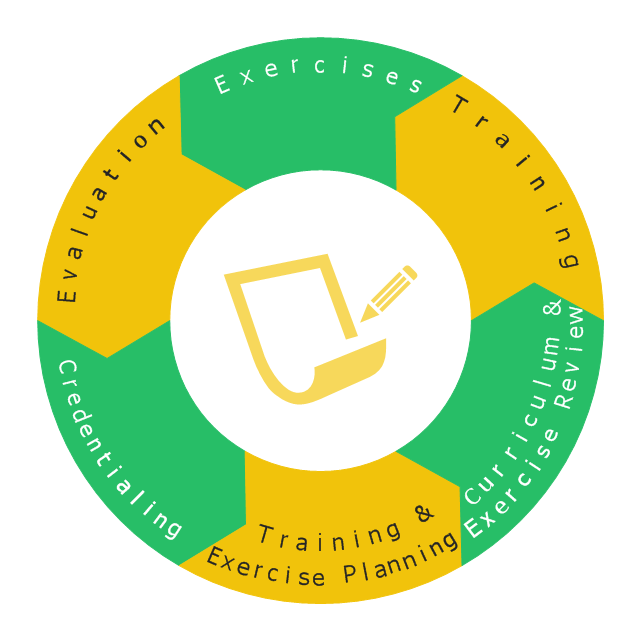
This wheel diagram sample illustrates the emergency preparedness training and exercise processes. It was designed on the base of the diagram on the webpage "Public Health Preparedness Training and Exercise" from the FloridaHealth website of the Florida Department of Health. [floridahealth.gov/ programs-and-services/ emergency-preparedness-and-response/ training-exercise/ ]
"Emergency Preparedness is the discipline of dealing with and avoiding both natural and manmade disasters. It involves mitigation, preparedness, response and recovery in order to lessen the impact of disasters. Emergency management requires a partnership among all levels of government (local, State, and Federal) and the private sector (business and industry, voluntary organizations, and the public). Successful preparedness requires detailed planning and cooperation among each sector." [Emergency Preparedness. Wikipedia]
The arrow donut chart example "Training and exercise process wheel" was created using the ConceptDraw PRO diagramming and vector drawing software extended with the Circular Arrows Diagrams solution from the area "What is a Diagram" of ConceptDraw Solution Park.
Circular arrows diagram
Used Solutions
How to Create a Bar Chart

Chart Maker for Presentations

Pyramid Diagram

Bar Diagrams for Problem Solving. Create space science bar charts with Bar Graphs Solution

- State operating funds | Donut Chart | Pie Donut Chart . Pie Chart ...
- Geo Map - USA - New Hampshire | Budgeted appropriations - Donut ...
- Png Donut Chart
- Budgeted appropriations | How to Create a Pie Chart | Sales ...
- Organizational chart - United States Department of Labor ...
- Donut Chart Templates | USA Maps | Basic Divided Bar Diagrams ...
- Pie Charts | Vector Map of Germany | Divided Bar Diagrams | State ...
- 2012 United States presidential election results | USA Maps | Geo ...
- State And Explain The Uses Of Chart In Auditing
- United States organic farms | Competitor Analysis | Pie Chart ...
- Organizational chart - New York State Education Department | Draw ...
- Percentages of the U.S. population by race | Pie Charts | Pyramid ...
- Senate votes on Budget Control Act of 2011, by state - Thematic ...
- Percentage Pie Chart . Pie Chart Examples | Atmosphere air ...
- Organizational chart - New York State Education Department ...
- State Chart Diagram For Atm Withdrawal
- Donut Chart Percentage
- Arrow circle chart - Template | Circular Arrows | Education infogram ...
- Vector stencils library - State machine diagram | Design elements ...