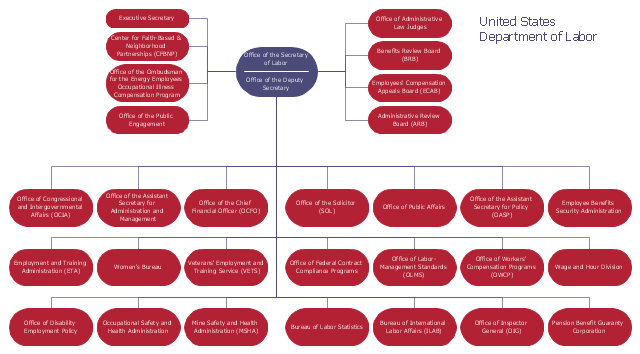
This organization chart sample was created on the base of the figure from the website of U.S. Department of Labor. [dol.gov/ dol/ aboutdol/ orgchart.htm]
"The United States Department of Labor (DOL) is a cabinet-level department of the U.S. federal government responsible for occupational safety, wage and hour standards, unemployment insurance benefits, re-employment services, and some economic statistics; many U.S. states also have such departments. The department is headed by the U.S. Secretary of Labor.
The purpose of the Department of Labor is to foster, promote, and develop the welfare of the wage earners, job seekers, and retirees of the United States; improve working conditions; advance opportunities for profitable employment; and assure work-related benefits and rights. In carrying out this mission, the Department of Labor administers and enforces more than 180 federal laws. These mandates and the regulations that implement them cover many workplace activities for about 10 million employers and 125 million workers." [United States Department of Labor. Wikipedia]
The organizational chart example "United States Department of Labor" was created using the ConceptDraw PRO diagramming and vector drawing software extended with the Organizational Charts solution from the Management area of ConceptDraw Solution Park.
Organizational chart
 Stakeholder Onion Diagrams
The Stakeholder Onion Diagram is often used as a way to view the relationships of stakeholders to a project goal. A basic Onion Diagram contains a rich information. It shows significance of stakeholders that will have has influence to the success achieve
This area chart sample shows the US federal prisoner population changes from 1914 to 2010.
"The Federal Bureau of Prisons (BOP) is a United States federal law enforcement agency. A subdivision of the U.S. Department of Justice, the Bureau is responsible for the administration of the federal prison system. The system also handles prisoners who committed acts considered felonies under the District of Columbia's law. The Bureau was established in 1930 to provide more progressive and humane care for federal inmates, to professionalize the prison service, and to ensure consistent and centralized administration of the 11 federal prisons in operation at the time.
According to its official web site, the Bureau consists of more than 116 institutions, six regional offices, its headquarters office in Washington, D.C., two staff training centers, and 22 community corrections offices, and is responsible for the custody and care of approximately 210,000 federal offenders. Approximately 82 percent of these inmates are confined in Bureau-operated correctional facilities or detention centers. The remainder are confined through agreements with state and local governments or through contracts with privately operated community corrections centers, detention centers, prisons, and juvenile facilities." [Federal Bureau of Prisons. Wikipedia]
This area graph sample was redesigned from the Wikimedia Commons file: Federal timeline US prisoners.gif. [commons.wikimedia.org/ wiki/ File:Federal_ timeline_ US_ prisoners.gif]
The area chart example "Federal timeline US prisoners" was created using the ConceptDraw PRO diagramming and vector drawing software extended with the Area Charts solution from the Graphs and Charts area of ConceptDraw Solution Park.
Area graph

IDEF0 standard with ConceptDraw PRO

Geo Map - USA - Wisconsin

 Basic Area Charts
This solution extends the capabilities of ConceptDraw PRO v10.3.0 (or later) with templates, samples and a library of vector stencils for drawing Area Charts (area graphs) that visualize changes in values by filling in the area beneath the line connecting data points.
HelpDesk
How to Create a Map of Germany Using ConceptDraw PRO

This wheel diagram sample illustrates the emergency preparedness training and exercise processes. It was designed on the base of the diagram on the webpage "Public Health Preparedness Training and Exercise" from the FloridaHealth website of the Florida Department of Health. [floridahealth.gov/ programs-and-services/ emergency-preparedness-and-response/ training-exercise/ ]
"Emergency Preparedness is the discipline of dealing with and avoiding both natural and manmade disasters. It involves mitigation, preparedness, response and recovery in order to lessen the impact of disasters. Emergency management requires a partnership among all levels of government (local, State, and Federal) and the private sector (business and industry, voluntary organizations, and the public). Successful preparedness requires detailed planning and cooperation among each sector." [Emergency Preparedness. Wikipedia]
The arrow donut chart example "Training and exercise process wheel" was created using the ConceptDraw PRO diagramming and vector drawing software extended with the Circular Arrows Diagrams solution from the area "What is a Diagram" of ConceptDraw Solution Park.
Circular arrows diagram

Used Solutions
 Pie Charts
Pie Charts are extensively used in statistics and business for explaining data and work results, in mass media for comparison (i.e. to visualize the percentage for the parts of one total), and in many other fields. The Pie Charts solution for ConceptDraw PRO v10 offers powerful drawing tools, varied templates, samples, and a library of vector stencils for simple construction and design of Pie Charts, Donut Chart, and Pie Graph Worksheets.
 Germany Map
The Germany Map solution contains collection of samples, templates and scalable vector stencil graphic maps, representing map of Germany and all 16 states of Germany. Use the Germany Map solution from ConceptDraw Solution Park as the base for various them
HelpDesk
Replace Your Current Diagramming Tool

Lean Six Sigma Diagram Software

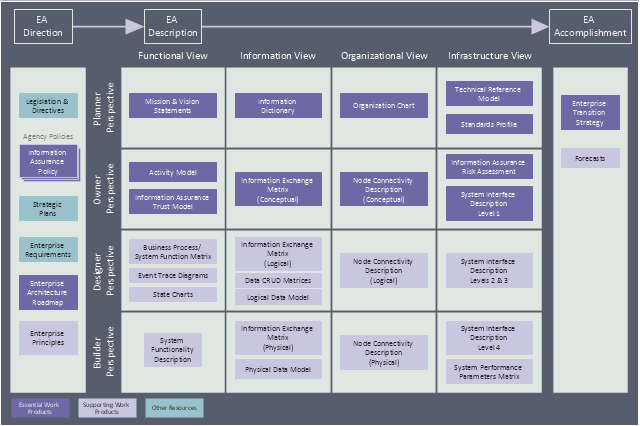
This enterprise architecture diagram sample was redesigned from the Wikipedia file: TEAF Work Products for EA Direction, Description, and Accomplishment.jpg. [en.wikipedia.org/ wiki/ File:TEAF_ Work_ Products_ for_ EA_ Direction,_ Description,_ and_ Accomplishment.jpg]
"Treasury Enterprise Architecture Framework (TEAF) was an Enterprise architecture framework for treasury, based on the Zachman Framework. It was developed by the US Department of the Treasury and published in July 2000. May 2012 this framework has been subsumed by evolving Federal Enterprise Architecture Policy as documented in "The Common Approach to Federal Enterprise Architecture".
The material presented here is obsolete and only useful for historical reference and is not the current policy in use by the Department of the Treasury." [en.wikipedia.org/ wiki/ Treasury_ Enterprise_ Architecture_ Framework]
The enterprise architecture diagram example "Resources and TEAF Work Products for EA Direction, Description, and Accomplishment" was created using the ConceptDraw PRO diagramming and vector drawing software extended with the Enterprise Architecture Diagrams solution from the Management area of ConceptDraw Solution Park.
Enterprise architecture diagram
This arrow ring chart sample was created on the base of the figure illustrating the webpage "National Preparedness Cycle. Plan" from the Federal Emergency Management Agency (FEMA) website. "Planning makes it possible to manage the entire life cycle of a potential crisis. Strategic and operational planning establishes priorities, identifies expected levels of performance and capability requirements, provides the standard for assessing capabilities and helps stakeholders learn their roles. The planning elements identify what an organization’s Standard Operating Procedures (SOPs) or Emergency Operations Plans (EOPs) should include for ensuring that contingencies are in place for delivering the capability during a large-scale disaster." [fema.gov/ plan]
The arrow ring chart example "National Preparedness Cycle" was created using the ConceptDraw PRO diagramming and vector drawing software extended with the Target and Circular Diagrams solution from the Marketing area of ConceptDraw Solution Park.
www.conceptdraw.com/ solution-park/ marketing-target-and-circular-diagrams
Arrow ring chart
ConceptDraw Arrows10 Technology

- Us Government Organizational Chart
- Government Organization Chart
- Mindmap Federal Government Organizational Chart
- How to Draw an Organization Chart | Organizational Charts ...
- Organizational chart - New York State Education Department ...
- How to Draw an Organization Chart | Organizational chart - New ...
- Organizational Charts with ConceptDraw PRO | Organization Chart ...
- Organizational Charts | How to Draw an Organizational Chart Using ...
- Organizational Charts | Basic Flowchart Symbols and Meaning ...
- Organizational Structure | How to Draw an Organization Chart ...
- How to Draw an Organization Chart | Organizational Structure ...
- How to Draw an Organization Chart | Organizational Structure ...
- Ad Agency Org Chart
- Chart Donut State
- Organizational chart - New York State Education Department | How ...
- Organizational Charts with ConceptDraw PRO | Basic Flowchart ...
- Organizational Structure | Examples of Flowcharts, Org Charts and ...
- Organization Chart Templates | Organizational chart - New York ...
- Geo Map - United States of America Map | Organizational chart ...