ConceptDraw Arrows10 Technology
When you are connecting existing objects you can control the diagram structure by changing selection order. This is how diagramming software should work. You are able to draw a diagram as quickly as the ideas come to you.Entity Relationship Diagram Symbols
The semantic modeling method nowadays is successfully applied in database structure design. It is effective method of modeling the data structures, which is based on the meaning of these data. As a tool of semantic modeling, there are used different types of Entity-Relationship Diagrams. Entity Relationship Diagram (ERD) is applied to visually and clearly represent a structure of a business database. The main components of ERDs are: entity, relation and attributes. An entity is a class of similar objects in the model, each entity is depicted in the form of rectangle and has the name expressed by a noun. Relation is shown in the form of non-directional line that connects two entities. There are several notation styles used for ERDs: information engineering style, Chen style, Bachman style, Martin Style. The Entity Relationship Diagram symbols used for professional ERD drawing are predesigned by professionals and collected in the libraries of the Entity-Relationship Diagram (ERD) solution for ConceptDraw DIAGRAM software.Interior Design. Registers, Drills and Diffusers — Design Elements
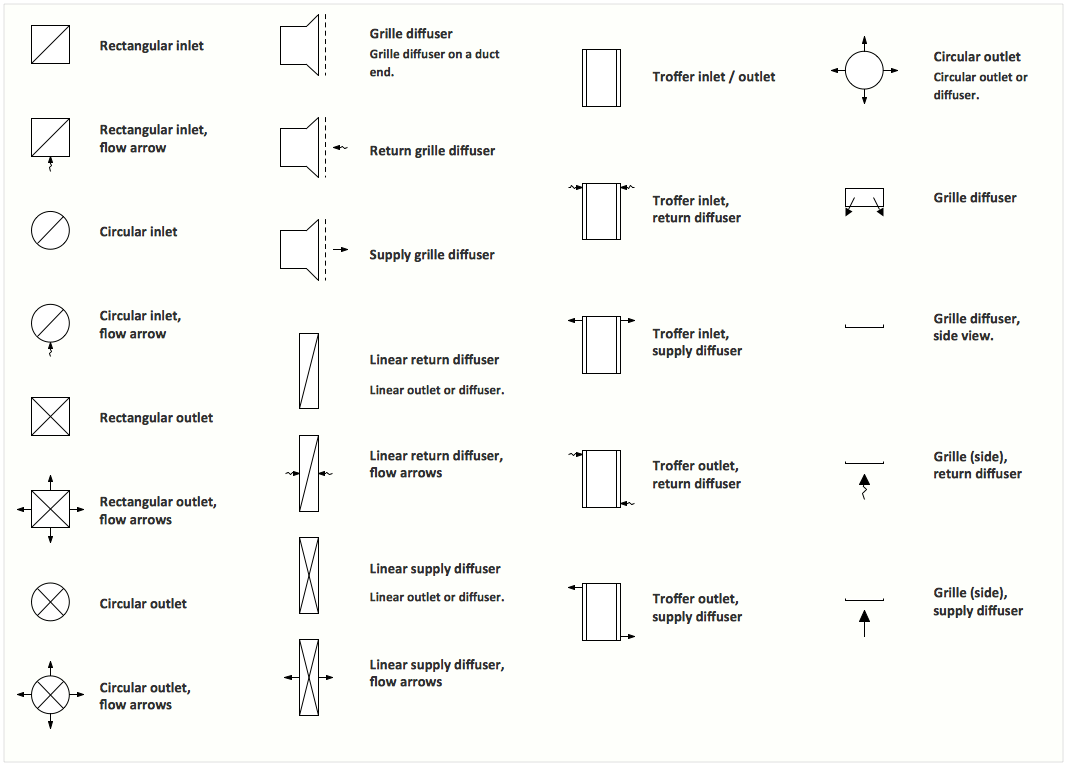
The interior design project for any home, flat, business center includes the set of different plans and documents, among them obligatory are the ceiling plans. For creation these plans will be convenient to use professional drawing software. It is especially useful in cases when you need create and propose for customer the multiple alternative design plans for choice. ConceptDraw DIAGRAM diagramming and vector drawing software extended with Reflected Ceiling Plan solution is the choice of architects, designers, electricians, and other building-related people. It is ideal for displaying the ceiling design ideas which meet any requirements of building and budget. Included templates, samples and especially wide selection of vector design elements, including the elements offered by Registers, Drills and Diffusers library are helpful in drawing without efforts professional-looking Reflected Ceiling plans, Reflective Ceiling plans, Lighting Plans, Electrical Plans, Plans of location the outlets, grilles, diffusers, registers, light fixtures, light panels, etc.Data Flow Diagram (DFD)
A Data Flow Diagram (DFD) illustrates the flow of data through an information system, visualizes how the information is handled in terms of inputs and outputs, how the data enter to system and leave it. It is effective to use a Data Flow Diagram for creation the system's overview, to show the system's scope and boundaries. There are two different types of notations for DFDs: Yourdon-Coad and Gane-Sarson, which differ in visual representations for processes, data flow, data stores, external entities, etc. Thus, for example the processes are depicted as circles in Yourdon-Coad notation and as rounded squares in Gane-Sarson notation. Gane-Sarson notation is usually used for visualization information systems and Yourdon-Coad - for system analysis and design. The Data Flow Diagrams solution included to Software Development area of ConceptDraw Solution Park offers a lot of DFD templates, samples and examples, libraries of vector stencils for construction without efforts the DFDs according to both Gane-Sarson and Yourdon-Coad notations.
 Business Diagrams
The Business Diagrams Solution extends ConceptDraw DIAGRAM with an extensive collection of professionally designed illustrative samples and a wide variety of vector stencils libraries, which are the real help for all business-related people, business analysts, business managers, business advisers, marketing experts, PR managers, knowledge workers, scientists, and other stakeholders allowing them to design the bright, neat, expressive and attractive Bubble Diagrams, Circle-Spoke Diagrams, Circular Arrows Diagrams, and Venn Diagrams with different quantity of sets in just minutes; and then successfully use them in documents, reports, statistical summaries, and presentations of any style.
The Best Flowchart Software Available
ConceptDraw gives the ability to draw Flowchart documents. Flowcharts solutionis a powerful tool that extends ConceptDraw application for drawing business flowcharts. ConceptDraw DIAGRAM ector diagramming and business graphics software enhanced with with templates, green and interactive flowchart makers, samples and stencil libraries from ConceptDraw Solution Park which all focused to help with drawing flowcharts, block diagrams, bar charts, histograms, pie charts, divided bar diagrams, line graphs, area charts, scatter plots, circular arrows diagrams, Venn diagrams, bubble diagrams, concept maps, and others.
Spa Floor Plan
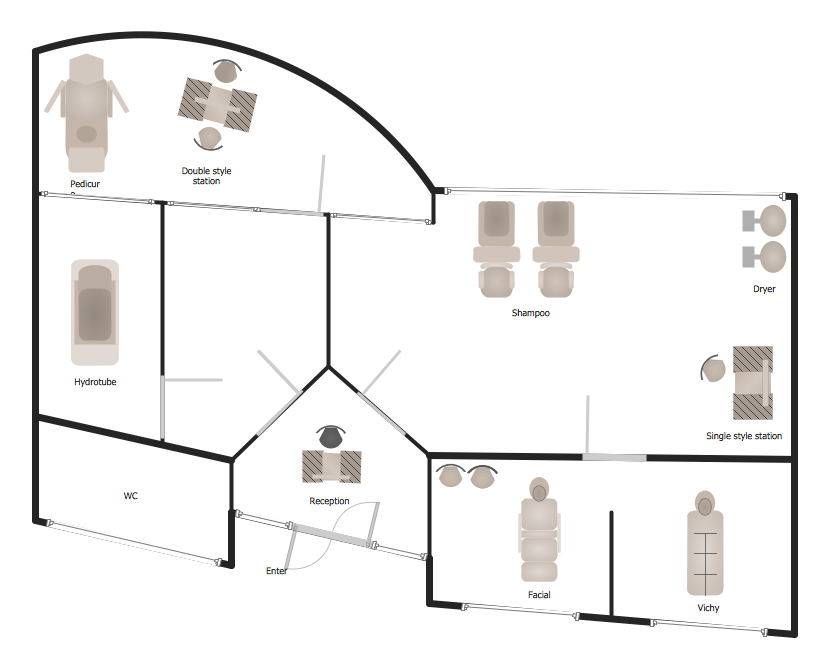
Designing Spa Floor Plan? What can be easier for ConceptDraw DIAGRAM users? Use the tools of Gym and Spa Area Plans solution from Building Plans area of ConceptDraw Solution Park to depict any of your ideas for the Spa Floor Plan.ERD Symbols and Meanings
Entity Relationship Diagram (ERD) is a popular software engineering tool for database modeling and illustration the logical structure of databases, which uses one of two notations - Chen's or Crow’s Foot. Crow's foot notation is effective when used in software engineering, information engineering, structured systems analysis and design. Each of these notations applies its own set of ERD symbols. Crow's foot diagrams use boxes to represent entities and lines between these boxes to show relationships. Varied shapes at the ends of lines depict the cardinality of a given relationship. Chen's ERD notation is more detailed way to represent entities and relationships. ConceptDraw DIAGRAM application enhanced with all-inclusive Entity-Relationship Diagram (ERD) solution allows design professional ER diagrams with Chen's or Crow’s Foot notation on your choice. It contains the full set of ready-to-use standardized ERD symbols and meanings helpful for quickly drawing, collection of predesigned ERD samples, examples and templates. ConceptDraw Pro is a great alternative to Visio for Mac users as it offers more features and can easily handle the most demanding professional needs.
Table Seating Chart Template
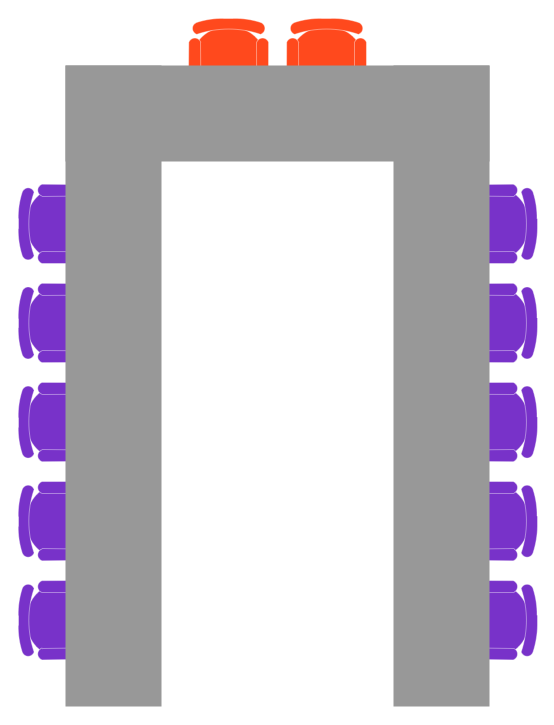
The arrangement of tables and seating charts near them have great value in many premises and situations. It is often very convenient to draw a plan before the furniture arrangement. ConceptDraw DIAGRAM software offers the Seating Plans solution from the Building Plans area for fast and easy drawing the table seating chart template and samples.Basic Flowchart Examples
ConceptDraw DIAGRAM is a business flowchart software includes the wide flowchart examples package.Classroom Seating Chart Maker
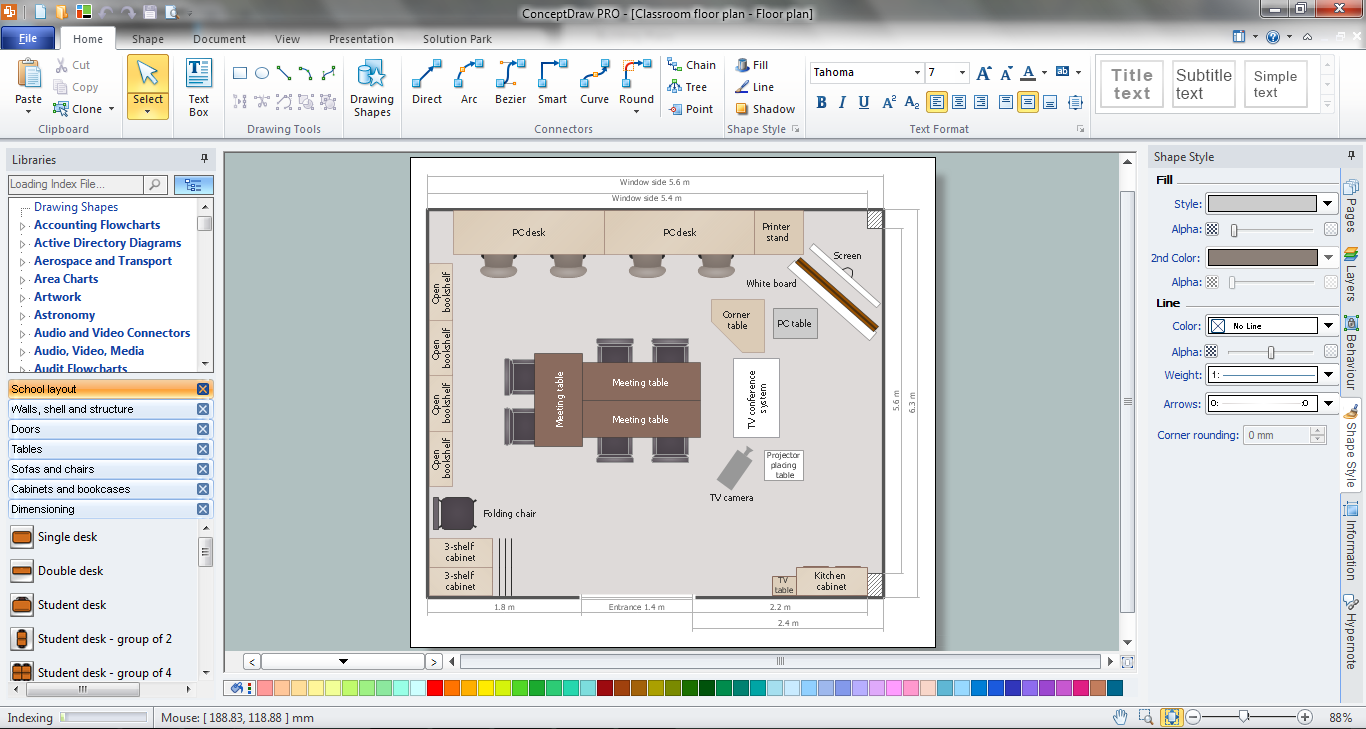
ConceptDraw DIAGRAM extended with School and Training Plans Solution from the Building Plans Area is a powerful Classroom Seating Chart Maker.Diagram Software - The Best Choice for Diagramming
For vector shapes and connector tools for quick and easy drawing diagrams for business, technology, science and education - The best choice for Diagramming is ConceptDraw DIAGRAM.How to Create a Pie Chart
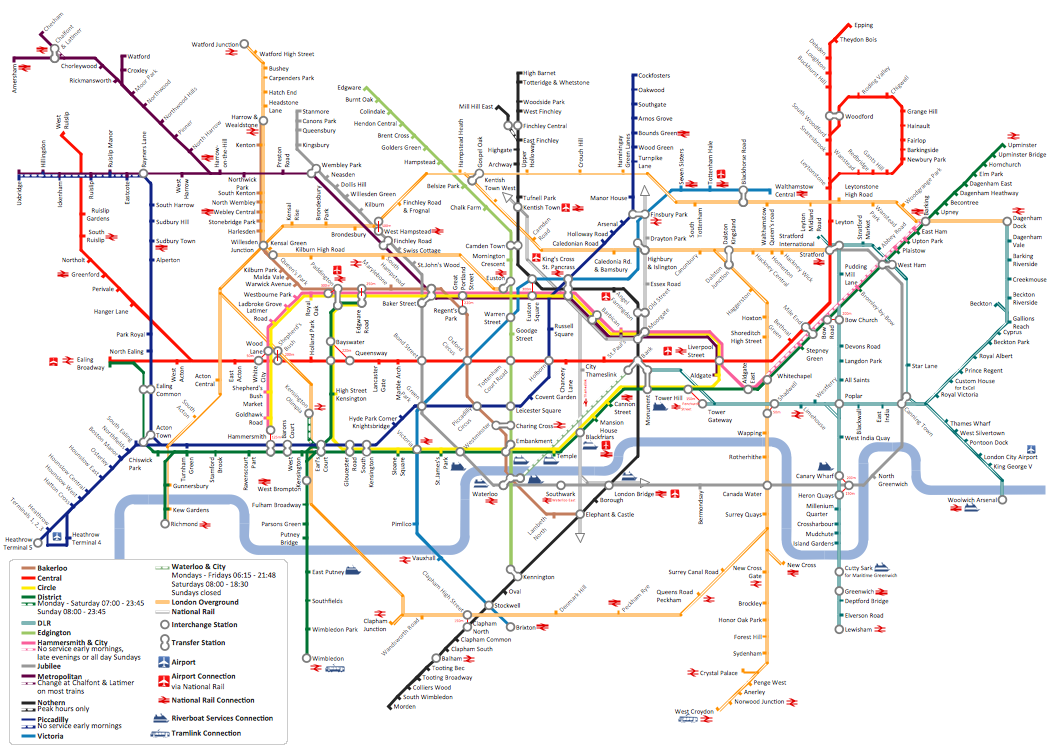
Create a Pie Chart with ConceptDraw software quickly and easily. The simple tutorial helps you learn how to create a pie chart.How to draw Metro Map style infographics? (London)
Tool to draw Metro Map styled inforgraphics. London Tube map sample.Symbol for Pool Table for Floor Plans
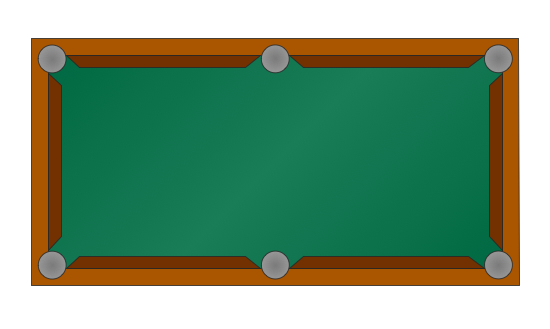
Below you can see the symbol for pool table. You can find this symbol in the library of the Floor Plans Solution and use it in your floor plan of the sport complex, home, etc. ConceptDraw DIAGRAM is a powerful diagramming and vector drawing software for creating the different Floor Plans. It’s very convenient, simple and quick to design the professional looking Floor Plans of any difficulty in ConceptDraw DIAGRAM.
 Data Flow Diagrams (DFD)
Data Flow Diagrams solution extends ConceptDraw DIAGRAM software with templates, samples and libraries of vector stencils for drawing the data flow diagrams (DFD).
Venn Diagram Examples for Problem Solving. Computer Science. Chomsky Hierarchy
A Venn diagram, sometimes referred to as a set diagram, is a diagramming style used to show all the possible logical relations between a finite amount of sets. In mathematical terms, a set is a collection of distinct objects gathered together into a group, which can then itself be termed as a single object. Venn diagrams represent these objects on a page as circles or ellipses, and their placement in relation to each other describes the relationships between them. The Venn diagram example below visualizes the the class of language inclusions described by the Chomsky hierarchy.Interior Design. Site Plan — Design Elements
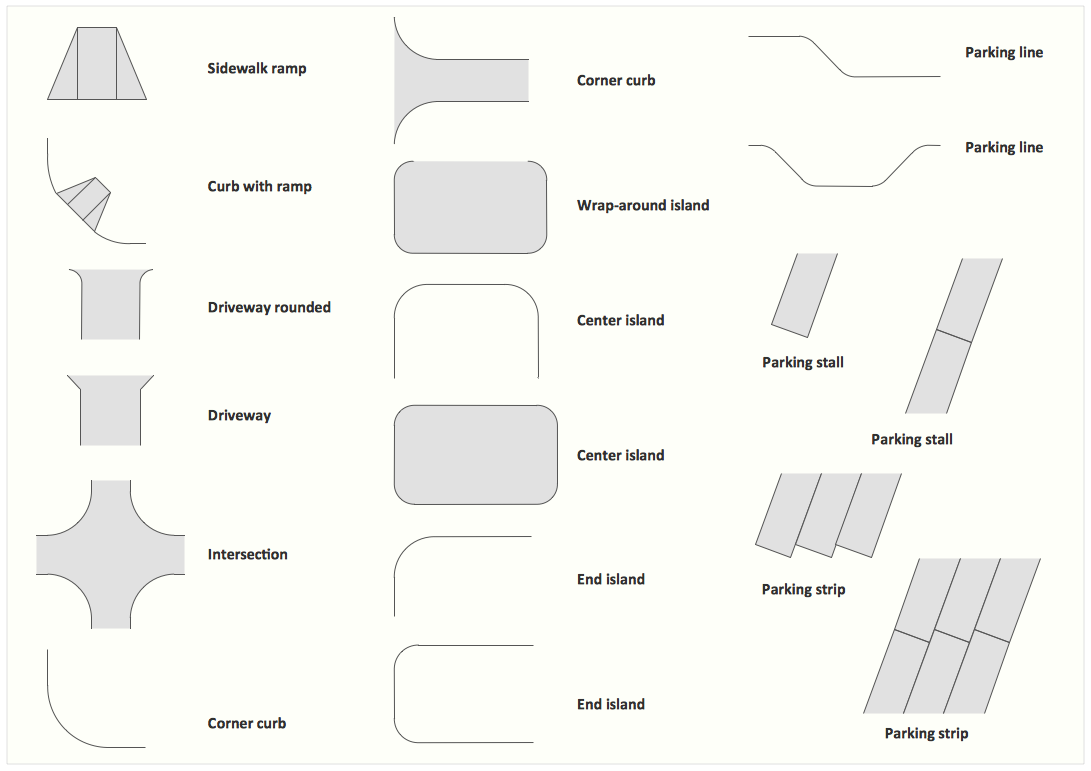
Site plans are large scale drawings that illustrate a lot of useful information, such as location of buildings on the surrounding territories, topography of the site, roads, footpaths, paved and hardstandings areas, ramps, parking areas, fencing, walls and gates, landscape elements, trees and plants, layout of external lighting and service runs, adjoining and adjacent structures, surrounding streets, and many other details. On each Site plan are also designated the scale, dimensions, site boundaries, key materials, and other additional notes. ConceptDraw DIAGRAM diagramming and interior design software extended with Site Plans solution from Building Plans area contains Parking and Roads, Site Accessories, Trees and Plants libraries with numerous collection of ready-to-use vector design elements for drawing detailed Site plans, Site design plans, Structural site plans, Landscape drawings for any locality and of any complexity without efforts. This software will be also useful for planning the parks, creation yard layouts, development residential and commercial landscape designs.Easy Flowchart Software
ConceptDraw the best professional flowchart software that gives users the ability to simply draw any type of flowcharts.HR Flowchart Symbols
Human resources are the people who make up the employee workforce of an organization or company. Human resource management has four basic functions: staffing, motivation, training and development, and maintenance. It is convenient to use the flowcharts to represent various HR processes and workflows. ConceptDraw DIAGRAM diagramming and vector drawing software extended with HR Flowcharts solution from the Management area of ConceptDraw Solution Park supplies you with comprehensive selection of predesigned vector HR flowchart symbols and standardized flowchart notation symbols, which allow you to design effectively the eye-catching infographics and diagrams relating to any human resource management process that will be relevant and understood by all business associates. The ConceptDraw DIAGRAM software offers also the set of predesigned flowchart and workflow templates and samples making your drawing process as easy as possible. Use the HR Flowcharts solution to create professional-looking HR Flowcharts and HRM Business Process Diagrams in a matter of moments.- Marketing Charts | Marketing Flow Chart | Marketing Diagrams ...
- ERD Symbols and Meanings | Entity Relationship Diagram Symbols ...
- Database Design | How To Create a Bubble Chart | Electrical ...
- Bubble diagrams in Landscape Design with ConceptDraw DIAGRAM
- Banquet Hall Plan Software | Wiring Diagram Floor Software ...
- How to Add a Bubble Diagram to PowerPoint Presentation | How To ...
- Drawing Illustration | How to Draw a Natural Landscape | Bubble ...
- How to Draw an Organization Chart | Marketing and Sales ...
- Design elements - Venn diagrams | Pyramid Charts | Bubble ...
- How To Draw In Pencil Sketch Disaster Management
- Bubble Chart | Human Resource Development | Flow chart Example ...
- Examples of Flowcharts, Org Charts and More | How To Create a ...
- Target and Circular Diagrams | Circle Spoke Diagram Template ...
- Flow chart Example. Warehouse Flowchart | Marketing and Sales ...
- Target market | How to Draw a Circle-Spoke Diagram | How to Draw ...
- Pie Chart Examples and Templates | Draw Company Structure with ...
- Design elements - Subway map, Map symbols | Design elements ...
- 5 Level pyramid model diagram - Information systems types ...
- Circle Diagrams | Circular Diagram | Best Diagramming | Circle ...
- Examples of Flowcharts, Org Charts and More | Business Diagram ...


