Flow Chart Symbols

Workflow Diagram Examples

IDEF0 Flowchart Symbols

Accounting Flowchart Symbols

Database Flowchart Symbols

Flow Chart Design — How to Design a Good Flowchart

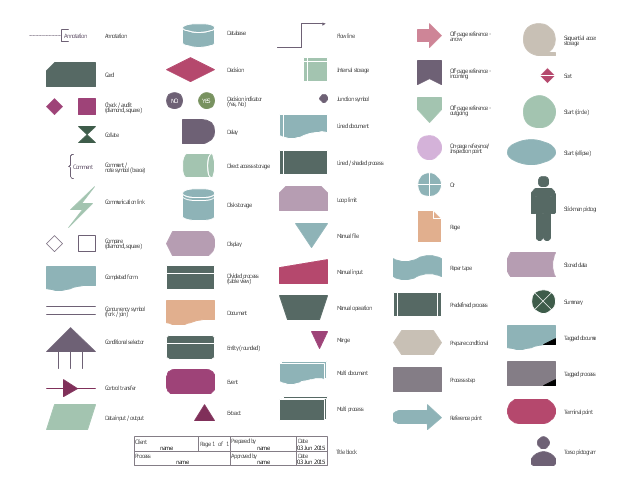
The vector stencils library "HR flowchart" contains 62 flow chart symbols.
Use it to design your HR flowcharts, workflow diagrams and process charts by the ConceptDraw PRO diagramming and vector drawing software.
"Flowcharts are used in designing and documenting simple processes or programs. Like other types of diagrams, they help visualize what is going on and thereby help understand a process, and perhaps also find flaws, bottlenecks, and other less-obvious features within it. There are many different types of flowcharts, and each type has its own repertoire of boxes and notational conventions. The two most common types of boxes in a flowchart are:
(1) a processing step, usually called activity, and denoted as a rectangular box,
(2) a decision, usually denoted as a diamond." [Flowchart. Wikipedia]
The shapes example "Design elements - HR flowchart" is included in the HR Flowcharts solution from the Management area of ConceptDraw Solution Park.
Flowchart symbols
Organizational Structure Diagram Software


Restaurant Floor Plan Software

The vector stencils library "Flowchart" contains 26 symbols for drawing the flow charts using the ConceptDraw PRO diagramming and vector drawing software.
"Flowcharts are used in designing and documenting complex processes or programs. Like other types of diagrams, they help visualize what is going on and thereby help the viewer to understand a process, and perhaps also find flaws, bottlenecks, and other less-obvious features within it. There are many different types of flowcharts, and each type has its own repertoire of boxes and notational conventions. The two most common types of boxes in a flowchart are:
(1) a processing step, usually called activity, and denoted as a rectangular box;
(2) a decision, usually denoted as a diamond.
A flowchart is described as "cross-functional" when the page is divided into different swimlanes describing the control of different organizational units. A symbol appearing in a particular "lane" is within the control of that organizational unit. This technique allows the author to locate the responsibility for performing an action or making a decision correctly, showing the responsibility of each organizational unit for different parts of a single process. ...
Common alternate names include: flowchart, process flowchart, functional flowchart, process map, process chart, functional process chart, business process model, process model, process flow diagram, work flow diagram, business flow diagram. The terms "flowchart" and "flow chart" are used interchangeably." [Flowchart. Wikipedia]
The example "Design elements - Flowchart" is included in the Flowcharts solution from the area "What is a Diagram" of ConceptDraw Solution Park.
Flowchart notation

Anyone Have an ERD Symbols Quick Reference?

Flowchart Software

Electrical Symbols — Qualifying

How to Create a Cross Functional Flow Chart

What is Entity-Relationship Diagram

"The symbols and conventions used in welding documentation are specified in national and international standards such as ISO 2553 Welded, brazed and soldered joints -- Symbolic representation on drawings and ISO 4063 Welding and allied processes -- Nomenclature of processes and reference numbers. The US standard symbols are outlined by the American National Standards Institute and the American Welding Society and are noted as "ANSI/ AWS".
In engineering drawings, each weld is conventionally identified by an arrow which points to the joint to be welded. The arrow is annotated with letters, numbers and symbols which indicate the exact specification of the weld. In complex applications, such as those involving alloys other than mild steel, more information may be called for than can comfortably be indicated using the symbols alone. Annotations are used in these cases." [Symbols and conventions used in welding documentation. Wikipedia]
The example chart "Elements of welding symbol" is redesigned using the ConceptDraw PRO diagramming and vector drawing software from the Wikipedia file: Elements of a welding symbol.PNG.
[en.wikipedia.org/ wiki/ File:Elements_ of_ a_ welding_ symbol.PNG]
The diagram example "Elements location of a welding symbol" is contained in the Mechanical Engineering solution from the Engineering area of ConceptDraw Solution Park.
Welding joint symbol chart

Chemistry Drawings

Soccer (Football) Dimensions
 Dimensions *")
Business Process Modeling Notation

Process Flow Diagram

- Basic Flowchart Symbols and Meaning | Entity Relationship ...
- Basic Flowchart Symbols and Meaning | Swim Lane Flowchart ...
- Design elements - HR flowchart | Flowchart Conventions Shapes
- Basic Flowchart Symbols and Meaning | Flow Chart Symbols ...
- Design elements - HR flowchart | A Flowchart Symbols Conventions
- Design elements - HR flowchart | Design elements - Sales flowchart ...
- Process Flow Diagram Symbols | Mechanical Drawing Symbols ...
- Network Glossary Definition | Fundamental Mechanical Drowing ...
- ERD Symbols and Meanings | Basic Flowchart Symbols and ...
- Database Flowchart Symbols | ERD Symbols and Meanings | Data ...