MS Visio Look a Like Diagrams

 Cisco Networking
Cisco Networking solution extends the ConceptDraw DIAGRAM software functionality with properties of network diagramming and network modeling software. Solution provides the multifarious samples and large quantity of libraries with incredibly huge amount of complex predesigned vector design elements of standardized Cisco devices and equipment, such as CISCO servers, Cisco switches, Cisco Fabric Interconnects, Cisco Gateways, Access Servers, Cisco Optical NCS 1000, Cisco Optical NCS 2000, Cisco Optical NCS 4000, and Cisco Optical NCS 4200 devices, Cisco Physical Security, Cisco Service Exchange, Cisco Storage Networking, Cisco Unified Communications, Cisco Video, Cisco Wireless, and Cisco Application Networking Services equipment.
HelpDesk
How To Create a CRM System Dashboard

The vector stencils library "Sales dashboard" contains 27 charts and graphic indicators.
Use it for drawing sales dashboards in the ConceptDraw PRO diagramming and vector drawing software extended with the Sales Dashboard solution from the Marketing area of ConceptDraw Solution Park.
Use it for drawing sales dashboards in the ConceptDraw PRO diagramming and vector drawing software extended with the Sales Dashboard solution from the Marketing area of ConceptDraw Solution Park.
Column Chart

Bar Chart

Line Chart

Divided Bar

Pie Chart

Two Bubbles Indicator

Speedometer Gauge 1

Speedometer Gauge 2

Speedometer Gauge 3

Speedometer Gauge 4

Slider Horizontal 1

Slider Horizontal 2

Slider Horizontal 3

Slider Horizontal 4

Slider Horizontal 5

Slider Horizontal 6

Slider Horizontal 7

Slider Vertical 1

Slider Vertical 2

Slider Vertical 3

Bullet 1

Bullet 2

Bullet 3

Bullet 4

Backgroung 1

Backgroung 2

Backgroung 3

The vector stencils library "Windows 8 apps" contains 40 shortcut icons of Windows 8 software applications.
Use this shortcut UI icon set to design graphic user interface (GUI) prototypes of your software apps for Windows 8.
"In computing, a file shortcut is a handle in a user interface that allows the user to find a file or resource located in a different directory or folder from the place where the shortcut is located.
Shortcuts are typically implemented as a small file containing a target URI or GUID to an object, or the name of a target program file that the shortcut represents. The shortcut might additionally specify parameters to be passed to the target program when it is run. Each shortcut can have its own icon. Shortcuts are very commonly placed on a desktop, in an application launcher panel such as the Microsoft Windows Start menu, or in the main menu of a desktop environment. ...
File shortcuts (also known as shell links) were introduced in Windows 95. Microsoft Windows uses .lnk as the filename extension for shortcuts to local files, and .URL for shortcuts to remote files, like web pages. Commonly referred to as "shortcuts" or "link files", both are displayed with a curled arrow overlay icon by default, and no filename extension. ...
Shortcut files can be used to launch programs in minimized or maximized window states if the program supports it. ...
Beginning with Windows 7, some shortcuts also store Application User Model IDs (AppUserModelIDs). Instead of the target command line, AppUserModelIDs may directly be used to launch applications. Shortcuts with AppUserModelIDs are used by some desktop programs and all WinRT Modern apps for launching." [File shortcut. Wikipedia]
The shortcut icons example "Windows 8 apps - Vector stencils library" was created using the ConceptDraw PRO diagramming and vector drawing software extended with the Windows 8 User Interface solution from the Software Development area of ConceptDraw Solution Park.
Alarms

Calculator
Calendar

Camera

Dashboard

Database

Exel 2013
Finance

Food + Drink

Games

Health + Fitness

Help+Tips

Internet Explorer

Language

Mail

Maps
Music

News

SkyDrive
OneNote
Outlook 2013

PC Settings
People

Photos

PowerPoint 2013
Reading List

Scanner

Sound Recorder

Skype

Sports

Store

Spreadsheet
Telemetry Center

Travel

Upload Center

Video

Viewer

Visio 2013
Weather

Word 2013
Sales Dashboard Template

 HR Dashboard
The HR Dashboard solution extends ConceptDraw DIAGRAM functionality with powerful drawing tools and great collection of comprehensive vector design elements, icons, pictograms and objects, navigation elements, live objects of HR charts, HR indicators, and thematic maps. The range of HR Dashboards applications is extensive, among them the human resource management, recruitment, hiring process, human resource development. ConceptDraw DIAGRAM software is perfect for creation HR Dashboard with any goal you need. It gives you all opportunities for designing not only informative, but also professional looking and attractive HR Dashboards of any style and degree of detalization, that are perfect for using in presentations, reports and other thematic documents.
 Customer Journey Mapping
Customer Journey Mapping Solution for ConceptDraw DIAGRAM opens incredibly broad opportunities for marketing and business specialists, product managers, designers, engineers, and other people interested in business development, increasing the product’s audience, its success and users' demand, providing them with capabilities of customer journey mapping. The included diagramming and customer journey mapping tools, predesigned vector customer journey mapping icons and charts, consumer journey mapping connectors, user journey and customer mapping figures, customer experience map icons and touchpoint icons, quick-start templates and samples provide excellent conditions for the customer journey mapping process, for creating Customer Journey Map and Customer Experience Map.
 Logistic Dashboard
The powerful tools of Logistic Dashboard solution and specially developed live graphic objects of logistic icons, logistic navigation elements, logistic indicators, logistic charts and logistic maps effectively assist in designing Logistic dashboards, Logistic maps, Logistic charts, diagrams and infographics. The included set of prebuilt samples and quick-start templates, demonstrates the power of ConceptDraw DIAGRAM software in logistics management, its assisting abilities in development, realization and analyzing the logistic processes, and in perfection the methods of logistics management.
This vector stencils library contains 195 cloud computing icons.
Use it to design cloud computing infographic and diagrams with ConceptDraw PRO software.
"Cloud computing, also on-demand computing, is a kind of Internet-based computing that provides shared processing resources and data to computers and other devices on demand. It is a model for enabling ubiquitous, on-demand access to a shared pool of configurable computing resources (e.g., networks, servers, storage, applications and services), which can be rapidly provisioned and released with minimal management effort. Cloud computing and storage solutions provide users and enterprises with various capabilities to store and process their data in third-party data centers.
Cloud computing has become a highly demanded service or utility due to the advantages of high computing power, cheap cost of services, high performance, scalability, accessibility as well as availability." [Cloud computing. Wikipedia]
The vector stencils library "Cloud clipart" is included in the Cloud Computing Diagrams solution from the Computer and Networks area of ConceptDraw Solution Park.
Access point

Airport

Alert

Banknote

Banknote bundle

Banknote bundles

Backup

Bar chart

Big data

Book (closed)
-cloud-clipart---vector-stencils-library.png--diagram-flowchart-example.png)
Book (open)
-cloud-clipart---vector-stencils-library.png--diagram-flowchart-example.png)
Books

Box, close

Box, open

Braces

Brackets

Bug

Building

Bus

Cable connection

Calculator

Calendar

Car

CD/DVD

Check list

Check mark

Clock

Cloud

Cloud computing

Cloud database

Cloud hosting

Cloud storage

Code

Coffee cup

Coin

Coins stack

Coins stacks

Communication

Computer terminal

Console

CPU

Credit card

Cubes

Dashboard

Database

Databases

Datacenter

Dialog box

Dialog boxes

Document

Documents

Dollar sign

Download

Earth

Email

Equal sign

Ethernet jack

Ethernet plug

Euro sign

Exclamation mark

Eye

Feed symbol

Feedback

File

Files

Filter

Firewall

Flash drive

Folder

Folders

Gamepad

Gauge

Gear

Gears, 2

Gears, 3

Globe

Hacker

Hard drive

Heart

Heart rhythm

Home

Hosting

Hotel

House

Image

Info

IP phone

Jet

Key

Keyboard

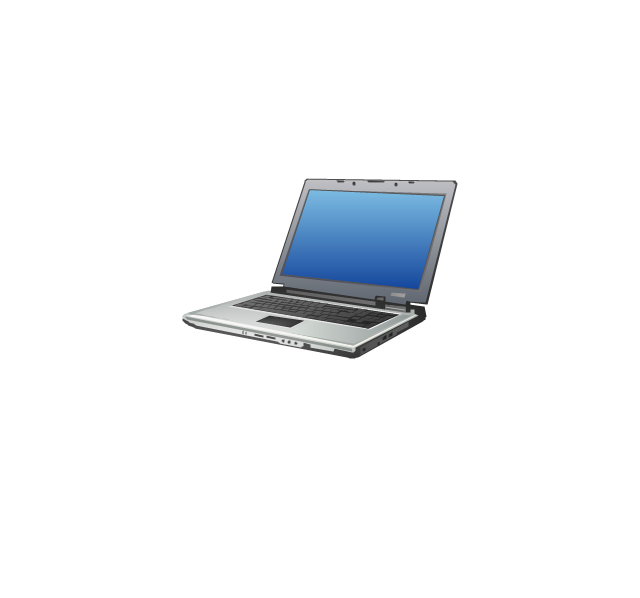
Laptop

Lego

Letter

Light bulb

Lightning

Line chart

Linux penguin

List

Load balancer

Location mark

Lock, close

Lock, open

Lock and key

Log

Login

Logout

Magnifying glass

Mail

Map

Memory (RAM)
-cloud-clipart---vector-stencils-library.png--diagram-flowchart-example.png)
Microphone

Minus sign

Mobile phone

Monitor

Mouse

Movie

Music

Music player

Network

Network bus

Newspaper

NIC (Network interface controller)
-cloud-clipart---vector-stencils-library.png--diagram-flowchart-example.png)
Not found (Error 404)
-cloud-clipart---vector-stencils-library.png--diagram-flowchart-example.png)
Notebook

Office printer

Operator

Page

Pages

PC

Pencil

Photo

Photo camera

Pie chart

Platform

Plus sign

Pound sign

Printer

Puzzle

Puzzles, 2x2

Puzzles, 3x3

Question sign

Rackmount server

Router

Safe

Satellite

Satellite antenna

Schedule

Sensor

Server

Server rack

Shield

Ship

Shopping bag

Shopping basket

Shopping cart

Sign up

Smartphone

Social network

Software box

Sound

Spider

Spreadsheet

SSD

Star

Stars, 5

Stethoscope

Stickman

Stickmen

Suitcase

Support

Switch

Syringe

Tablet computer

Tools

Train

Truck

Truck 2

TV

Umbrella

Upload

User man

User woman

User profile

Video

Video camera

Video mail

Virtual disk

Virus

Wallet

Web camera

Wifi antenna

Wireless

Wrench

X cross symbol

Yen sign

 Correlation Dashboard
Correlation Dashboard solution can be used while creating the dashboards in the ConceptDraw DIAGRAM diagramming and drawing software. This solution contains the set of the Live Objects that were designed for helping to visualize a predictive relationship between two numerical parameters of items from one or few series by using the Scatter Plot Charts.
 Frequency Distribution Dashboard
Frequency distribution dashboard solution extends ConceptDraw DIAGRAM software with samples, templates and vector stencils libraries with histograms and area charts for drawing the visual dashboards showing frequency distribution of data. It is useful for many specialists such as HR managers and other managers who intend to develop their business with the help of the progressive tools.
 Object-Role Modeling (ORM) Diagrams
Object-role Modeling (ORM) Diagram solution with powerful vector diagramming and data modeling tools, large quantity of specially developed samples and examples, and rich variety of vector objects corresponding to common ORM notation, ideally suits for developing the comprehensive, clear and visual Object-role Modeling (ORM) diagrams and schematics, understandable for all interested people from the different fields and business directions, for designing the ORM models, and demonstrating advantages from the use of ORM and its notation. It is intended for software developers and computer engineers, specialists in a field of Object-oriented programming (OOP), database architects, web-application constructors and developers, etc.
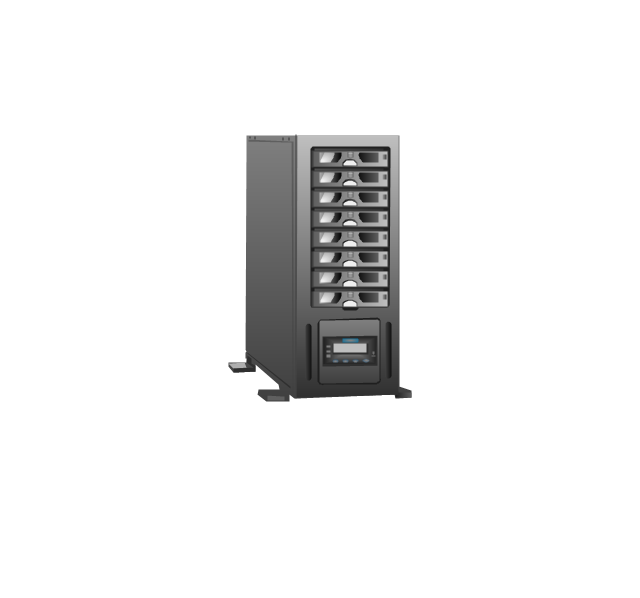
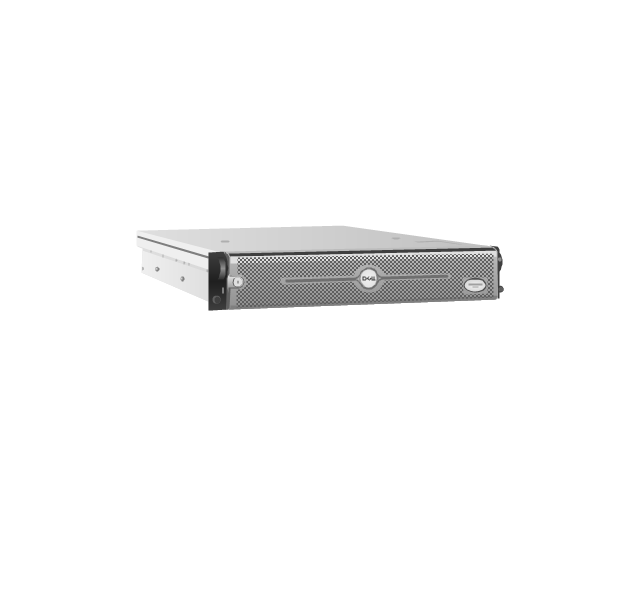
 Rack Diagrams
The Rack Diagrams solution can be used while working in the ConceptDraw DIAGRAM diagramming and drawing software in order to create the necessary Rack diagrams. Choosing any of the 54 vector shapes from its stencil library, you can use the Rack Diagrams solution for drawing various types of Rack diagrams or Server rack diagrams visualizing 19" rack mounted computers and servers. The Rack Diagrams solution, additionally including a collection of samples and a quick-start template, can be useful for many users of the ConceptDraw DIAGRAM who deal with computer networks, such as IT specialists; computer, network and telecommunication engineers; software engineers, technical writers, IT managers, system administrators, technical support, webmasters, system architects and engineers.
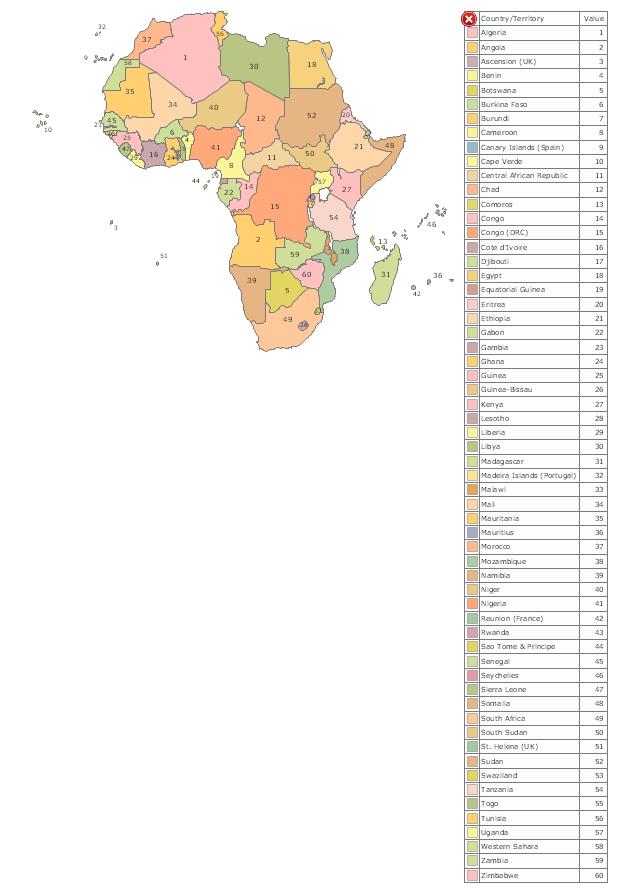
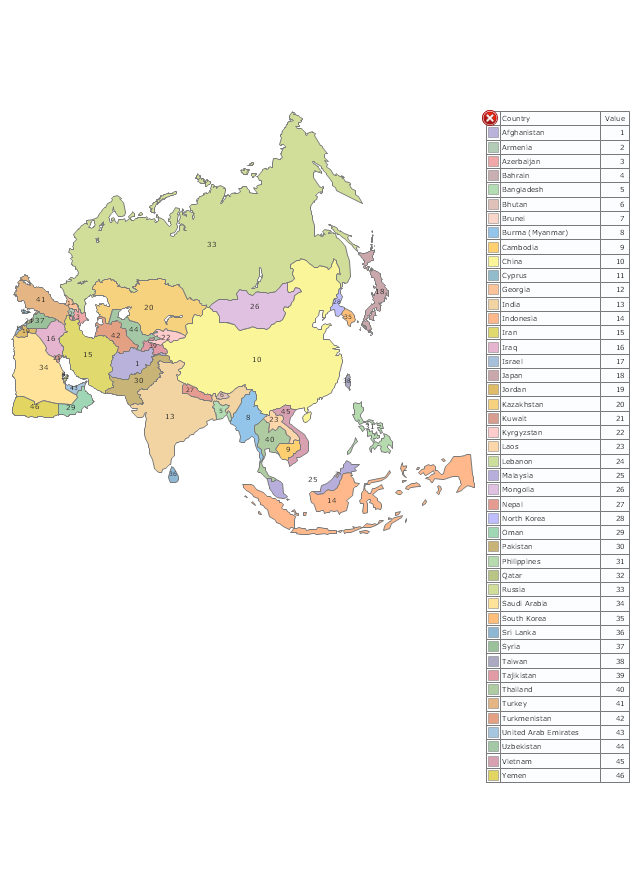
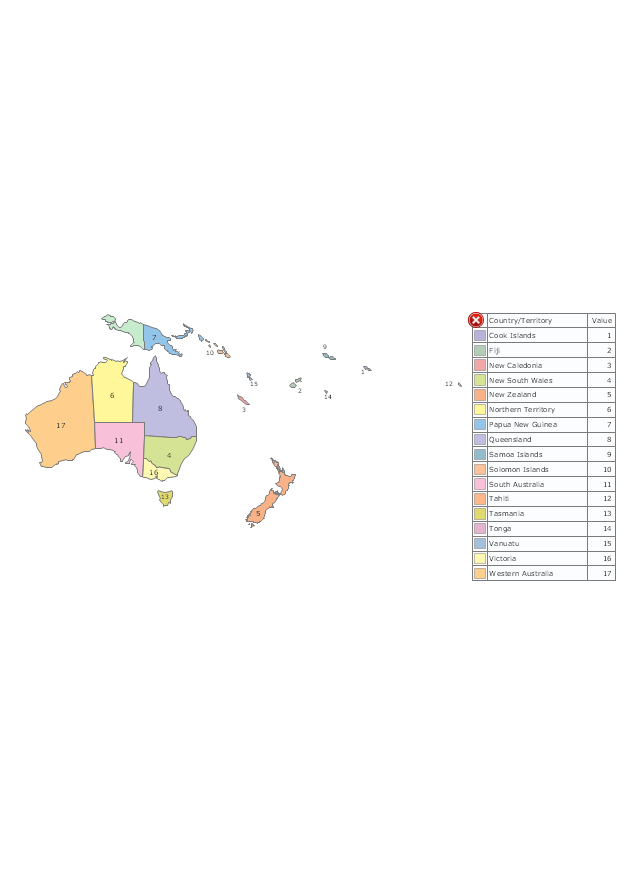
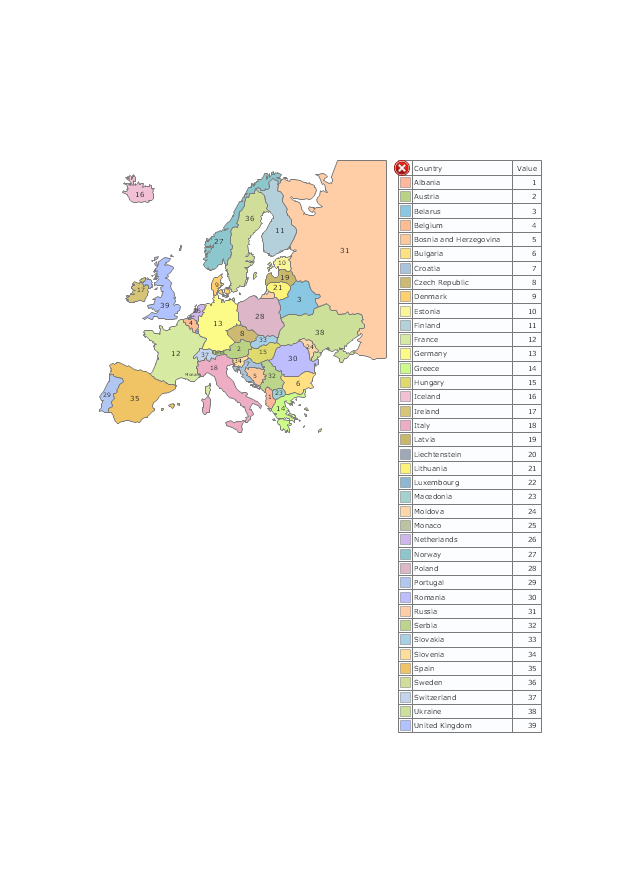
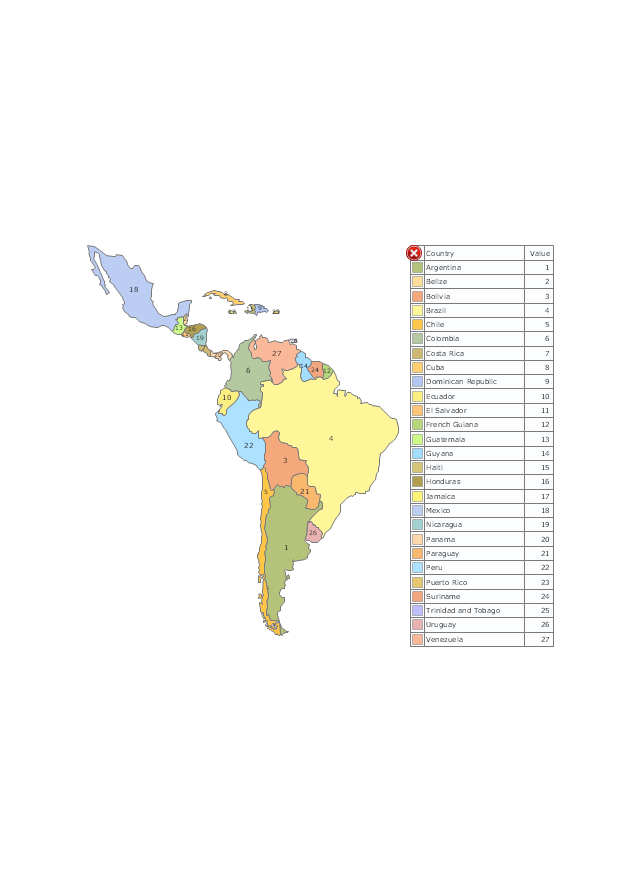
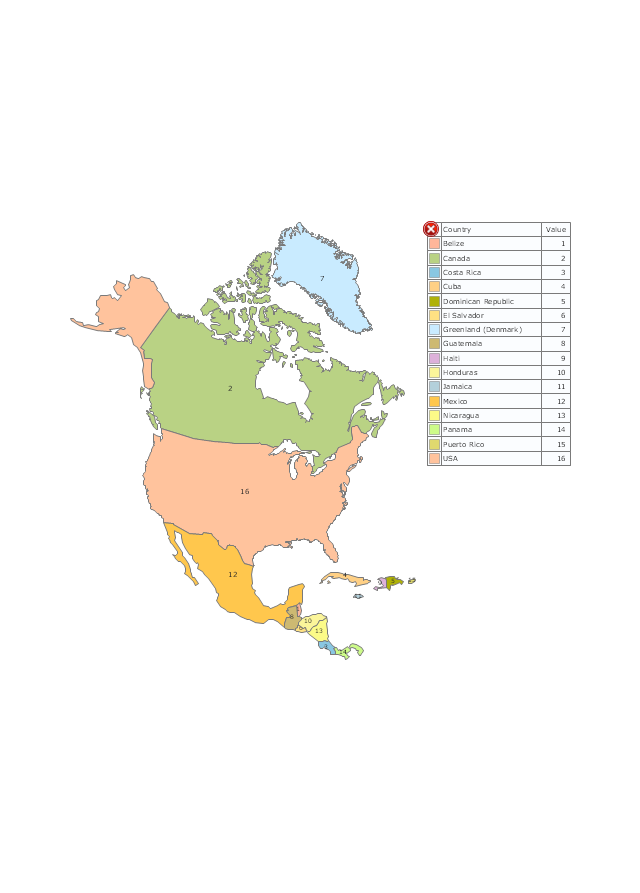
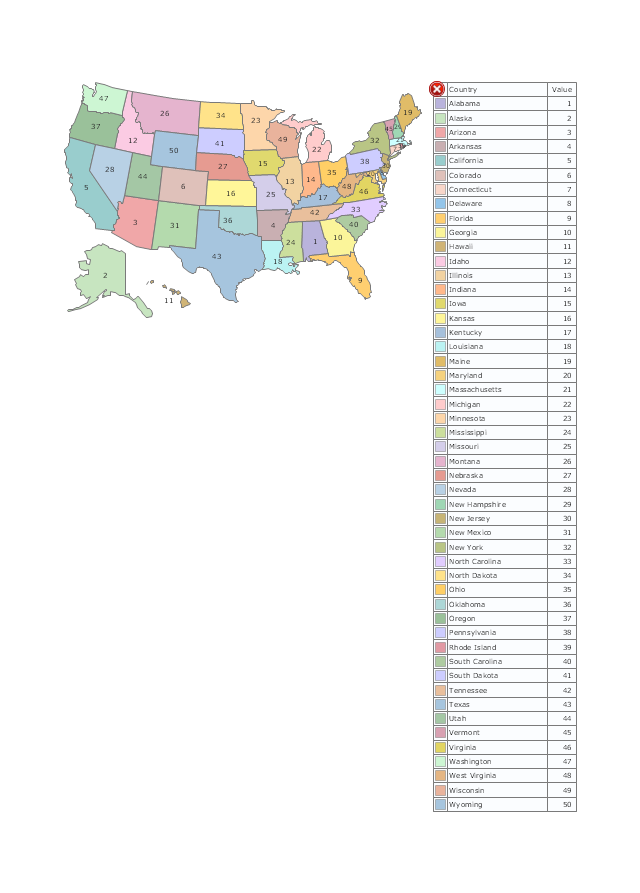
The vector stencils library "Thematic maps" contains 7 continent map contours.
Use it for drawing thematic maps of geographic regions displaying the metric values by countries, states and territories marked by different colors in the ConceptDraw PRO diagramming and vector drawing software extended with the Spatial Dashboard solution from the area "What is a Dashboard" of ConceptDraw Solution Park.
Use it for drawing thematic maps of geographic regions displaying the metric values by countries, states and territories marked by different colors in the ConceptDraw PRO diagramming and vector drawing software extended with the Spatial Dashboard solution from the area "What is a Dashboard" of ConceptDraw Solution Park.
Africa
Asia
Australia and Oceania
Europe
Latin America
North America
USA
HelpDesk
How to Use ConceptDraw Dashboard for Facebook on PC

Bar Chart Template for Word

Graphical User Interface Examples

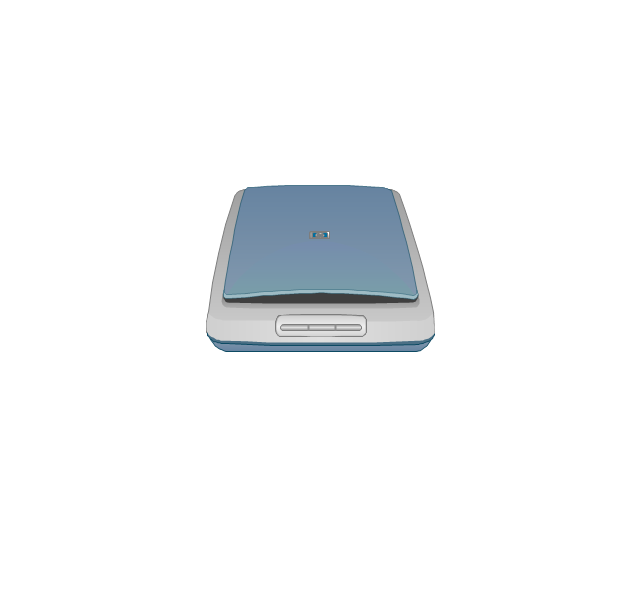
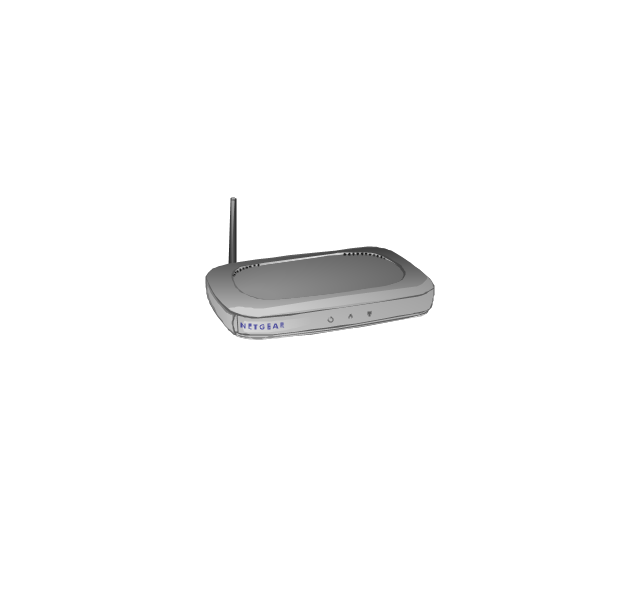
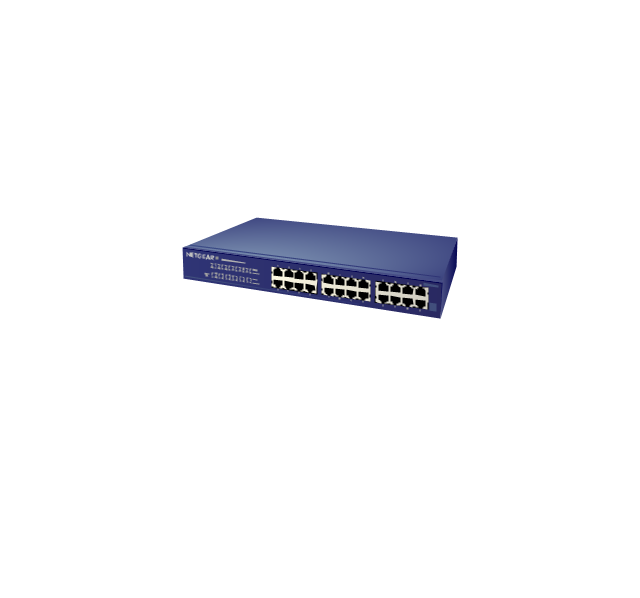
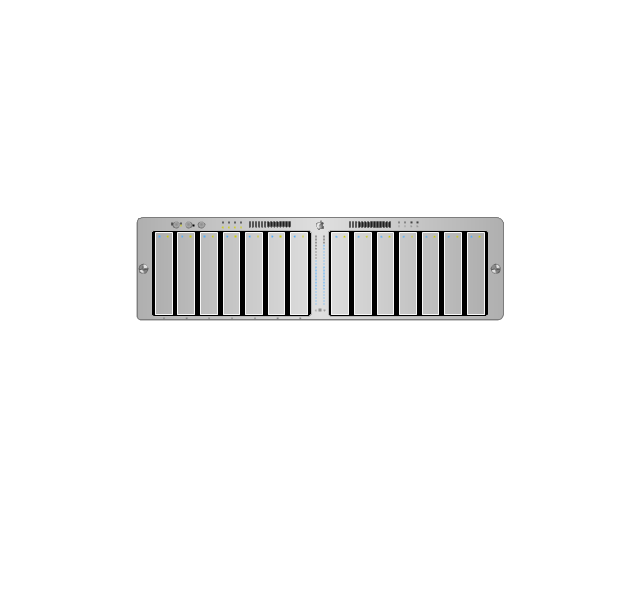
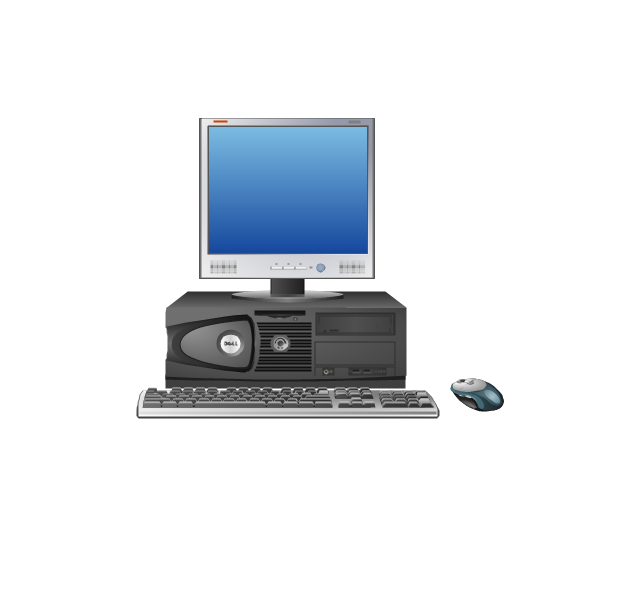
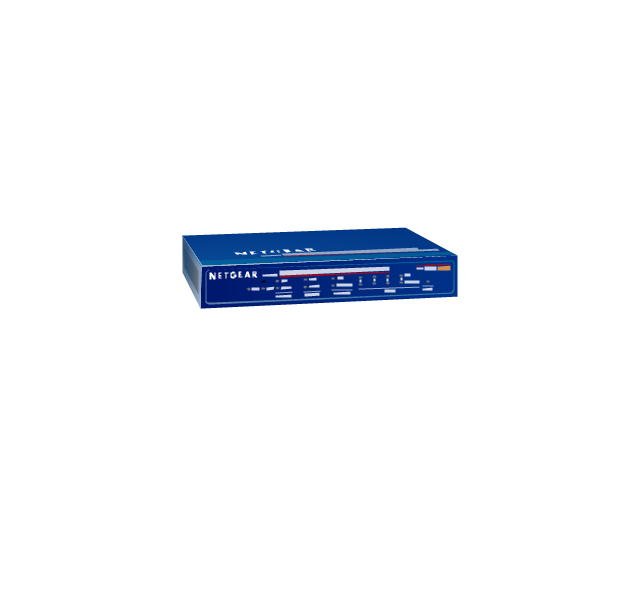
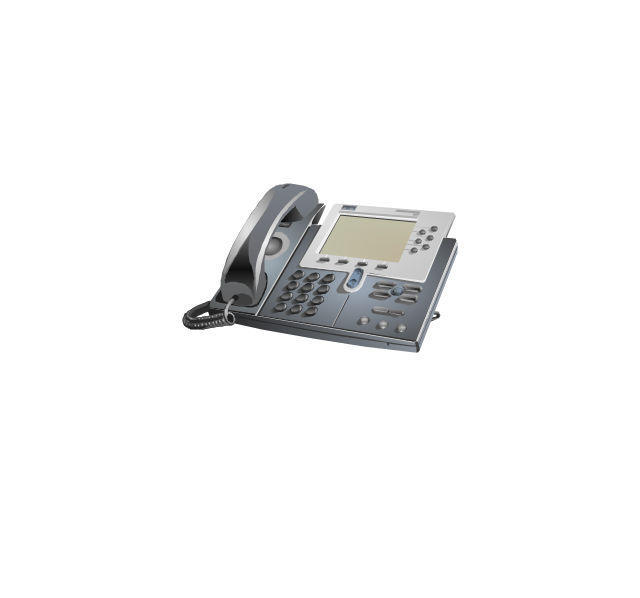
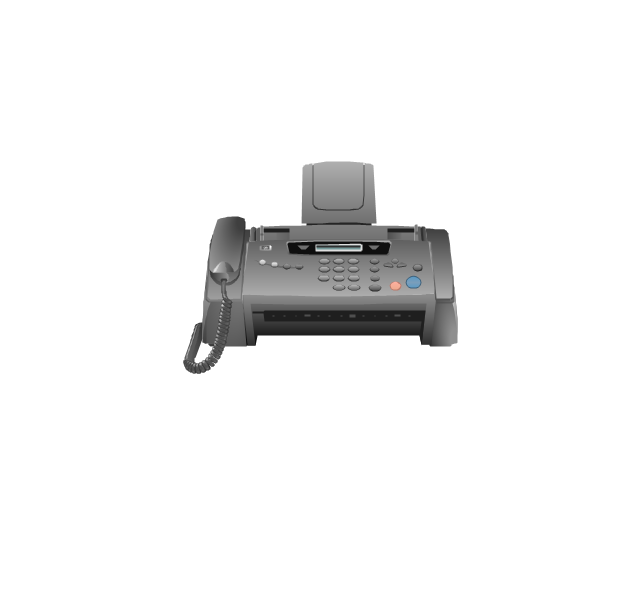
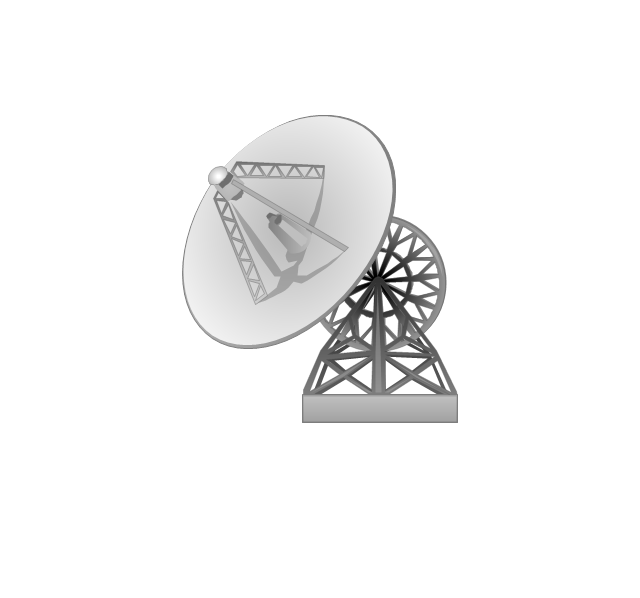
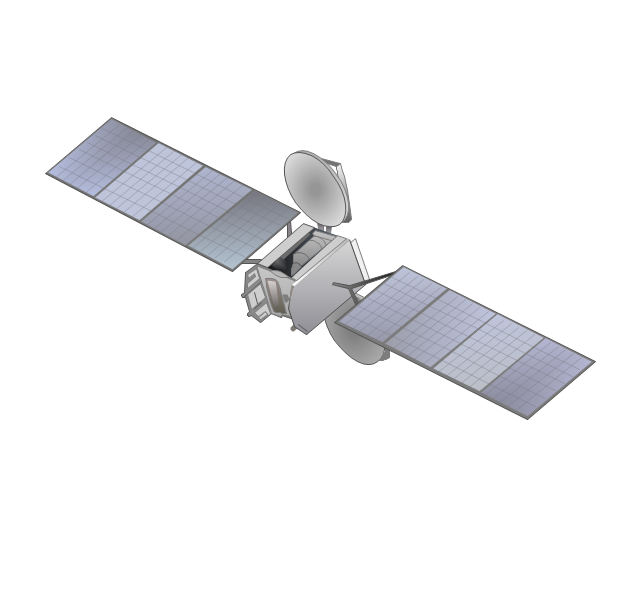
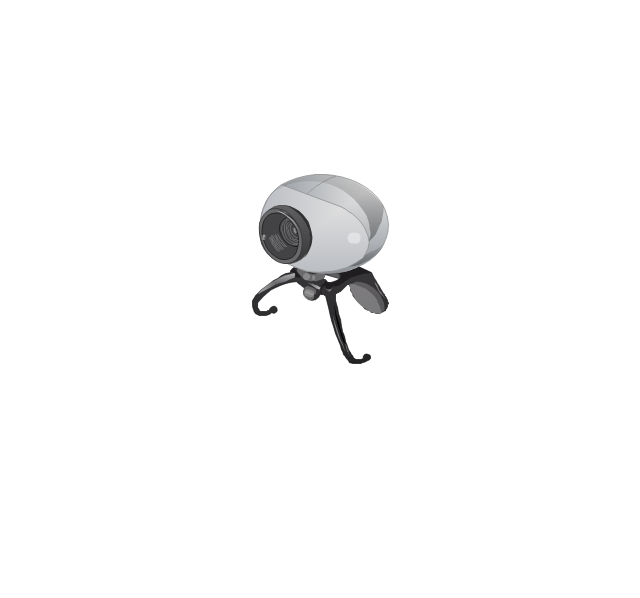
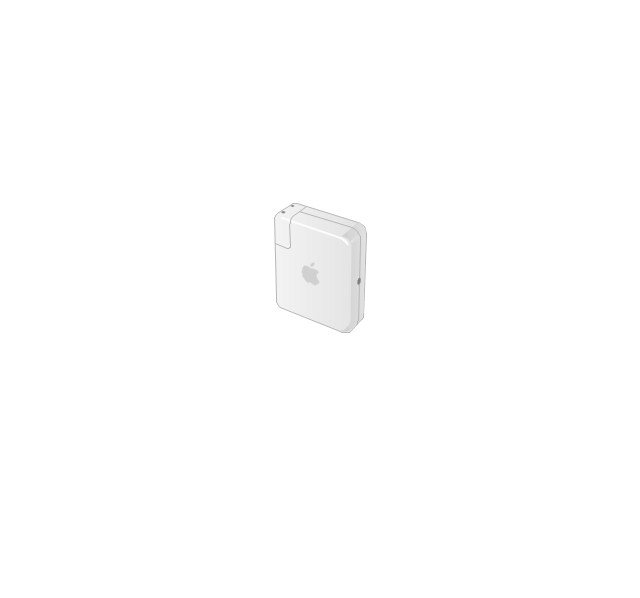
The vector stencils library "Computer network" contains 51 symbols of computer network devices and equipment for drawing computer network diagrams.
"Network Mapping Software.
A number of software tools exist to design computer network diagrams / or generate visual maps of networks, servers, storage, services, data centers, and other peripherals. Broadly, there are two types of software tools - those that help create diagrams manually and those that generate them using automated / semi-automated approaches.
Type of Software.
(1) Manual - allows users to design and draw logical and physical topology diagrams by manually placing icons and connections.
(2) Automated - generate topology diagrams / maps by traversing the network and automatically discovering resident devices or by importing network data." [Comparison of network diagram software. Wikipedia]
ConceptDraw PRO is the software for manual design of computer network diagrams. The solutions of the Computer and Networks area in ConceptDraw Solution Park extend ConceptDraw PRO with vector stencils libraries, templates and examples for creating the computer network diagrams.
The symbols example "Computer network - Vector stencils library" was created using the ConceptDraw PRO diagramming and vector drawing software extended with the Computer and Networks solution from the Computer and Networks area of ConceptDraw Solution Park.
www.conceptdraw.com/ solution-park/ computer-and-networks
Laptop
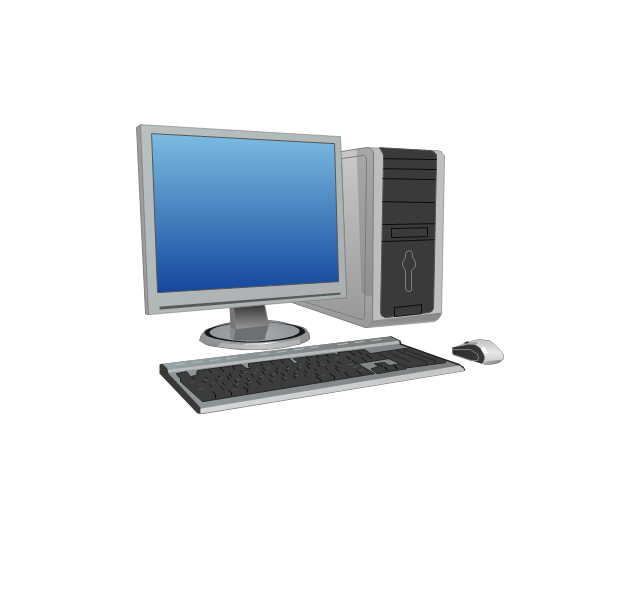
Desktop computer
Firewall
Bus

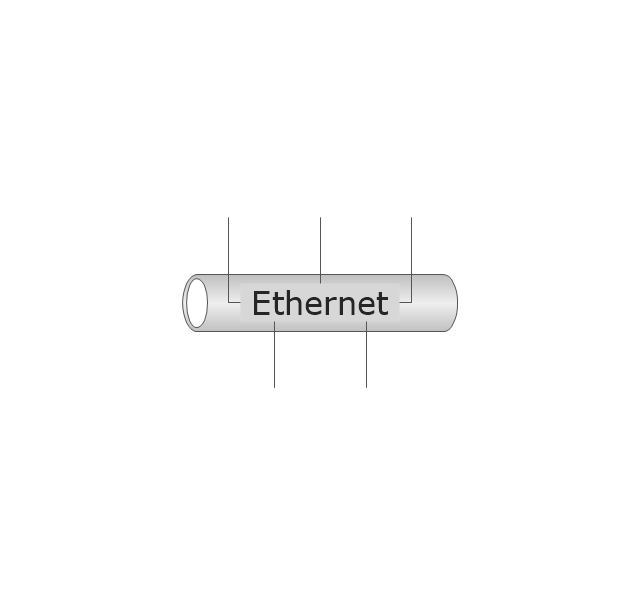
Ethernet
Star network

FDDI Ring

Token-ring

Comm-link

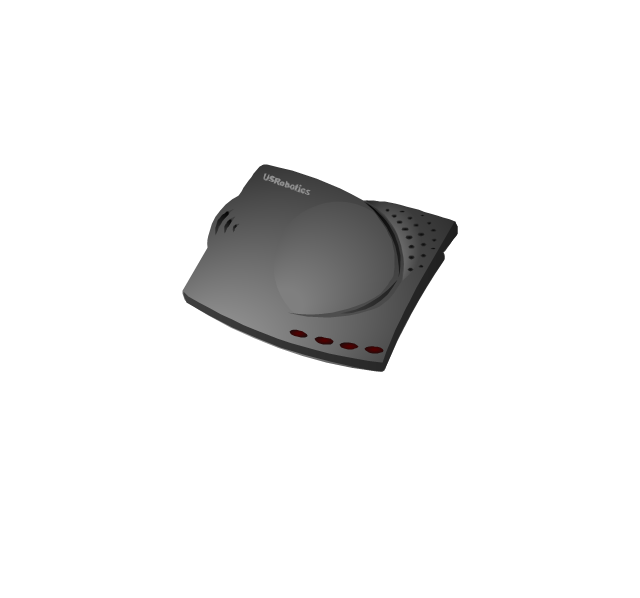
Modem
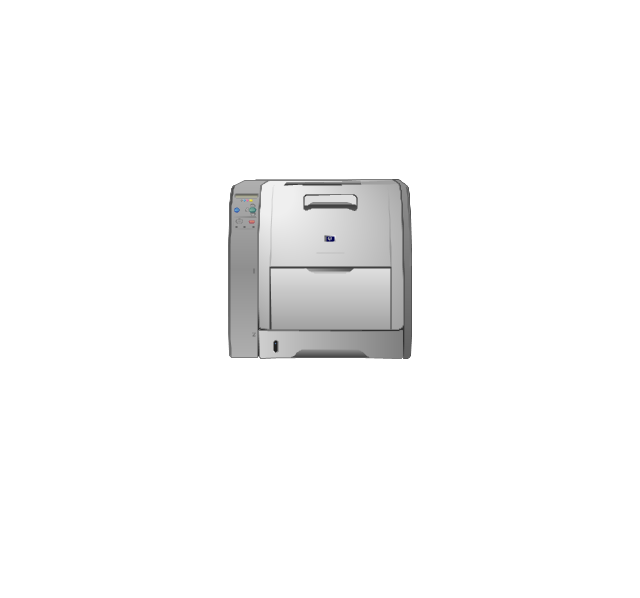
Laser printer
Inkjet printer
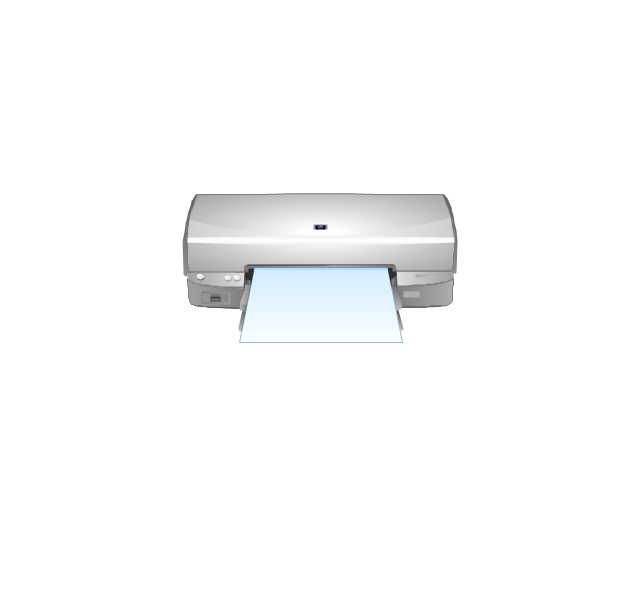
Image scanner
City

Ethernet hub

Wireless router
Network switch
iPod Classic

iPhone/ iPod Touch

Xserve RAID
XServe
Apple Thunderbolt Display

Data store
Mac Pro
iMac
RAID
Mainframe

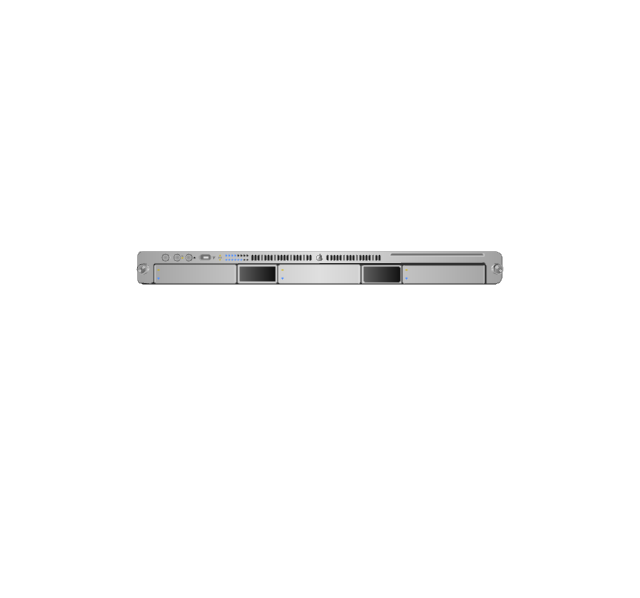
Rack-mountable server
Server

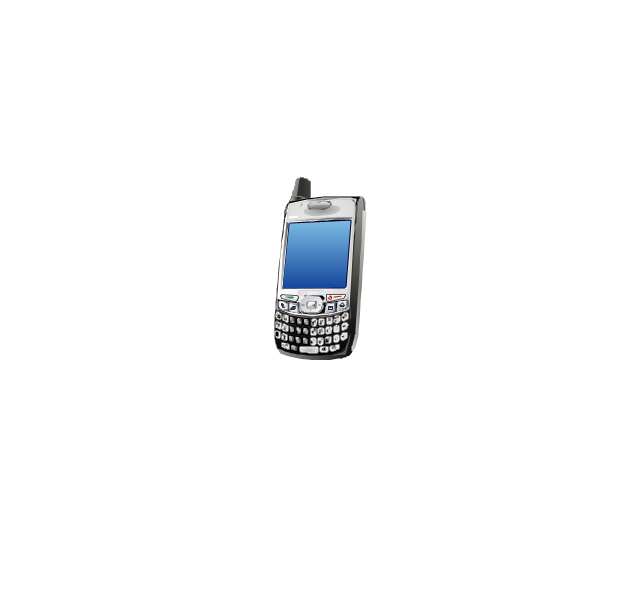
PDA
Cloud

Computer monitor
Workstation
Router
IP Phone
Fax
Mobile phone
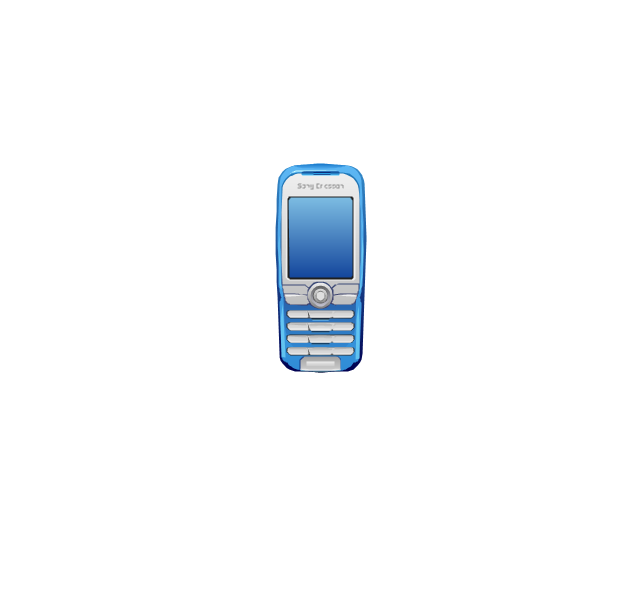
Smartphone
Compact Disk

Mouse

Apple Wireless Mouse

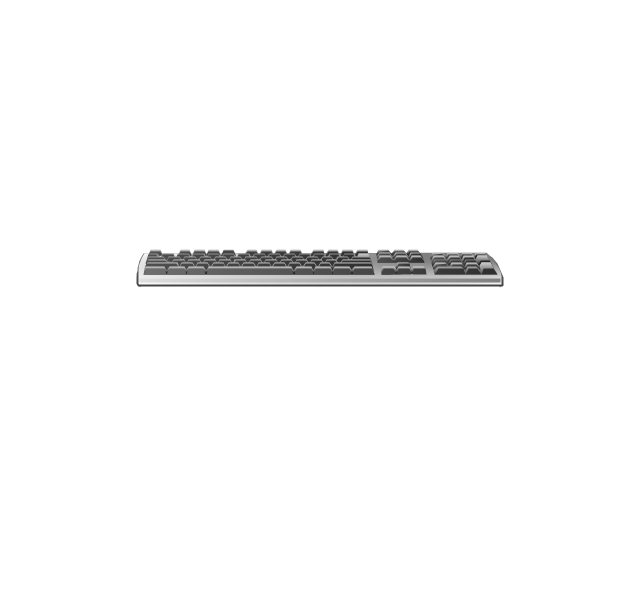
Computer keyboard
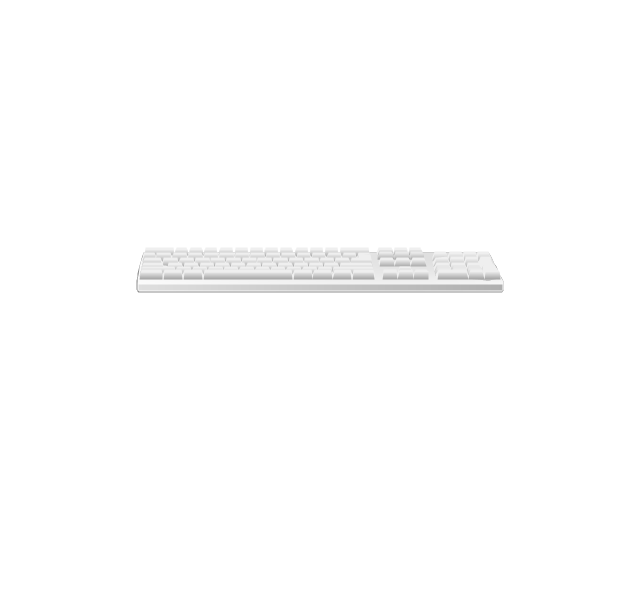
Apple Keyboard
Radio tower

Satellite dish
Satellite
Webcam
AirPort Extreme

Airport Express
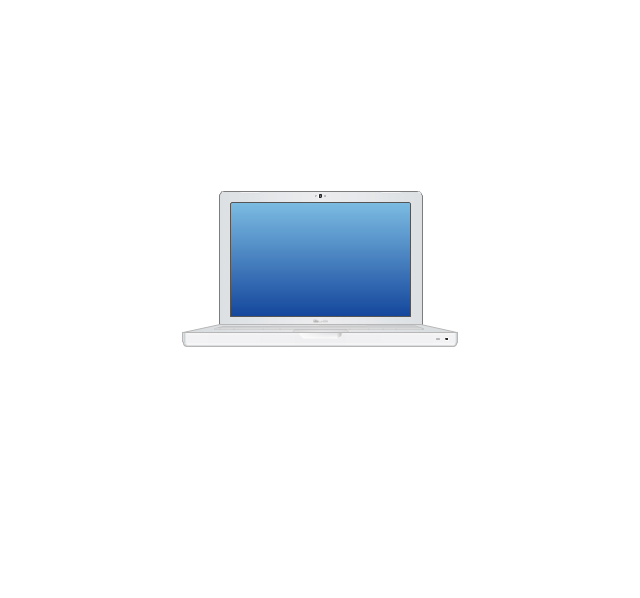
MacBook
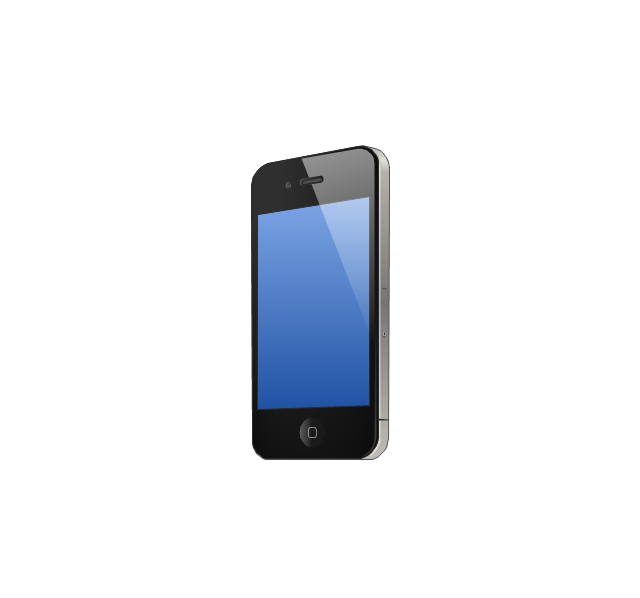
iPhone 4
- Logistic Dashboard | Process Flowchart | Logistic Visio Stencil
- Plant Layout Plans | Dashboard Design Visio Stencil
- KPI Dashboard | Dashboard | Sales Dashboard | Dashboard Visio
- How to Create a Meter Dashboard | Gauge To Visio
- AWS Architecture Diagrams | Visio Dashboard Template
- How to Use ConceptDraw Dashboard for Facebook on PC | How to ...
- Network Diagram Examples | Interactive Voice Response Diagrams ...
- Telecommunication Network Diagrams | How To Create a MS Visio ...
- How To Create a Concept Map in Visio | Visio Mind Map Stencil