HelpDesk
How to Create a Meter Dashboard

Cause and Effect Diagrams

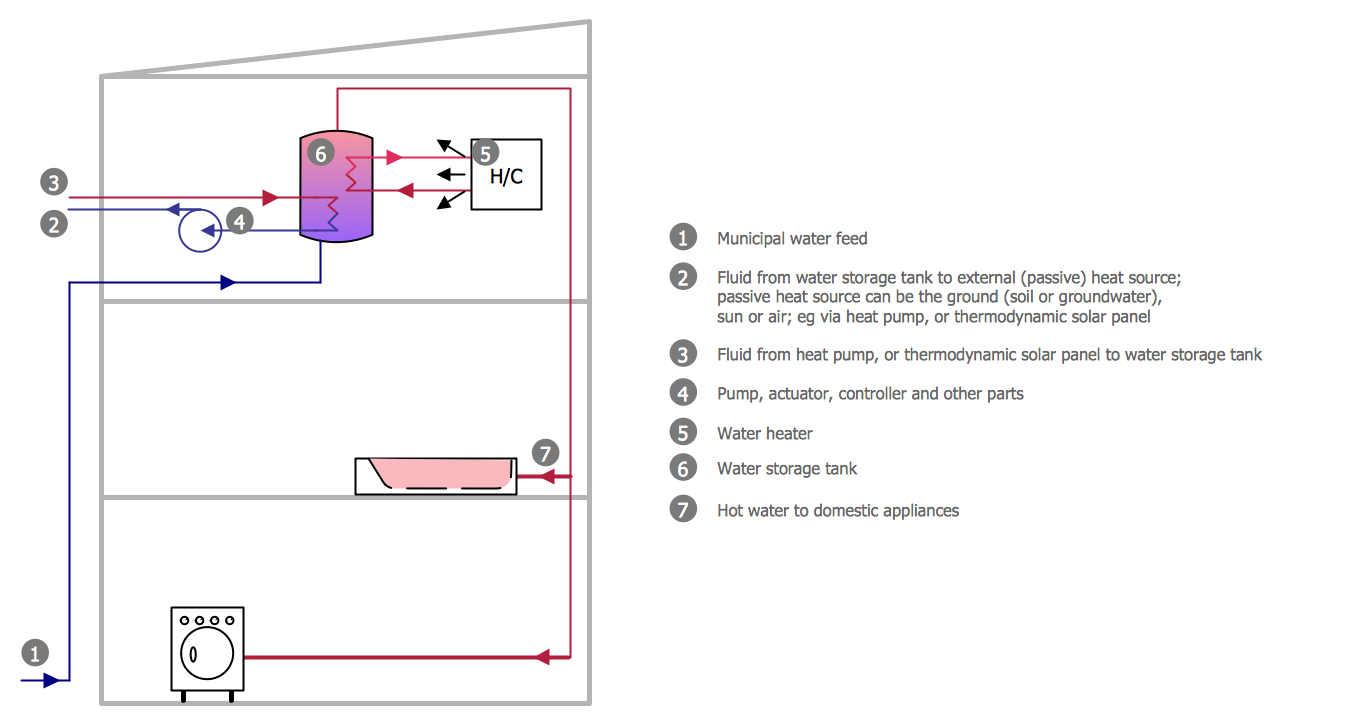
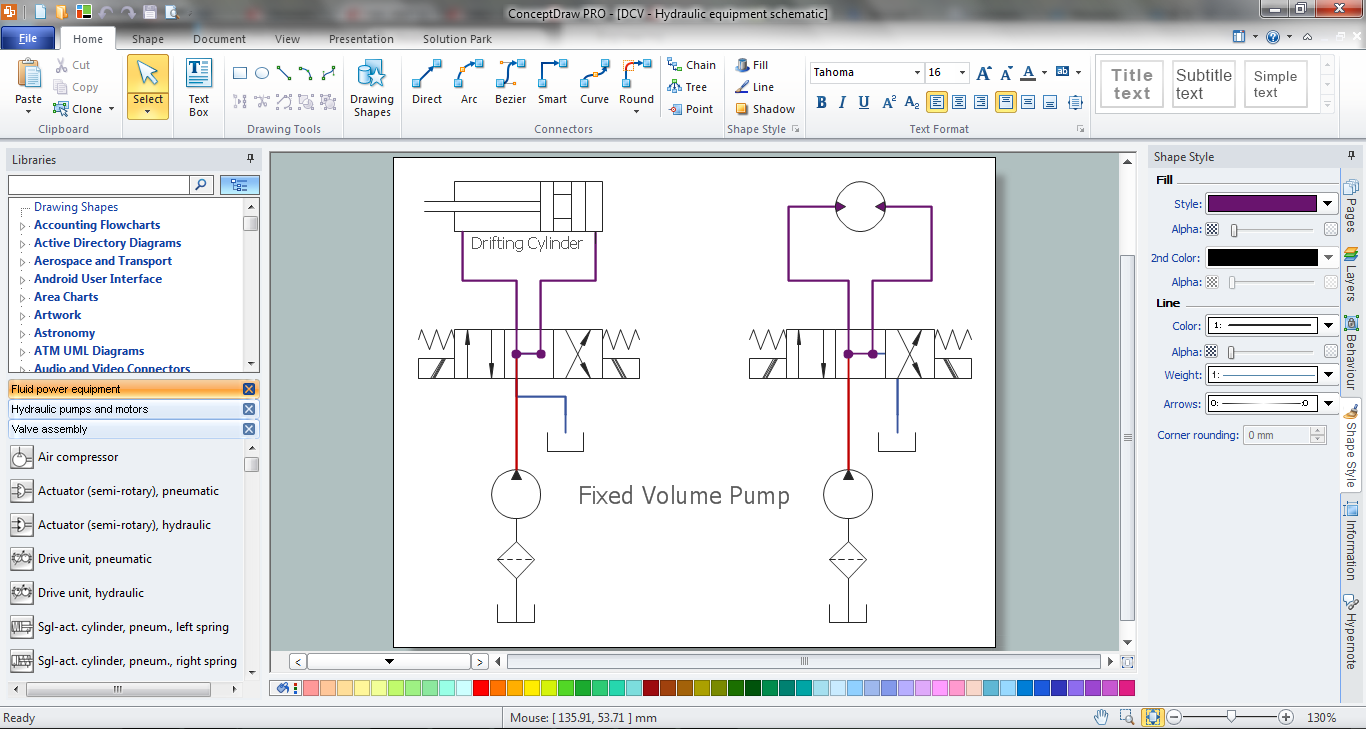
Mechanical Design Software
HelpDesk
How To Create an HR Metric Dashboard

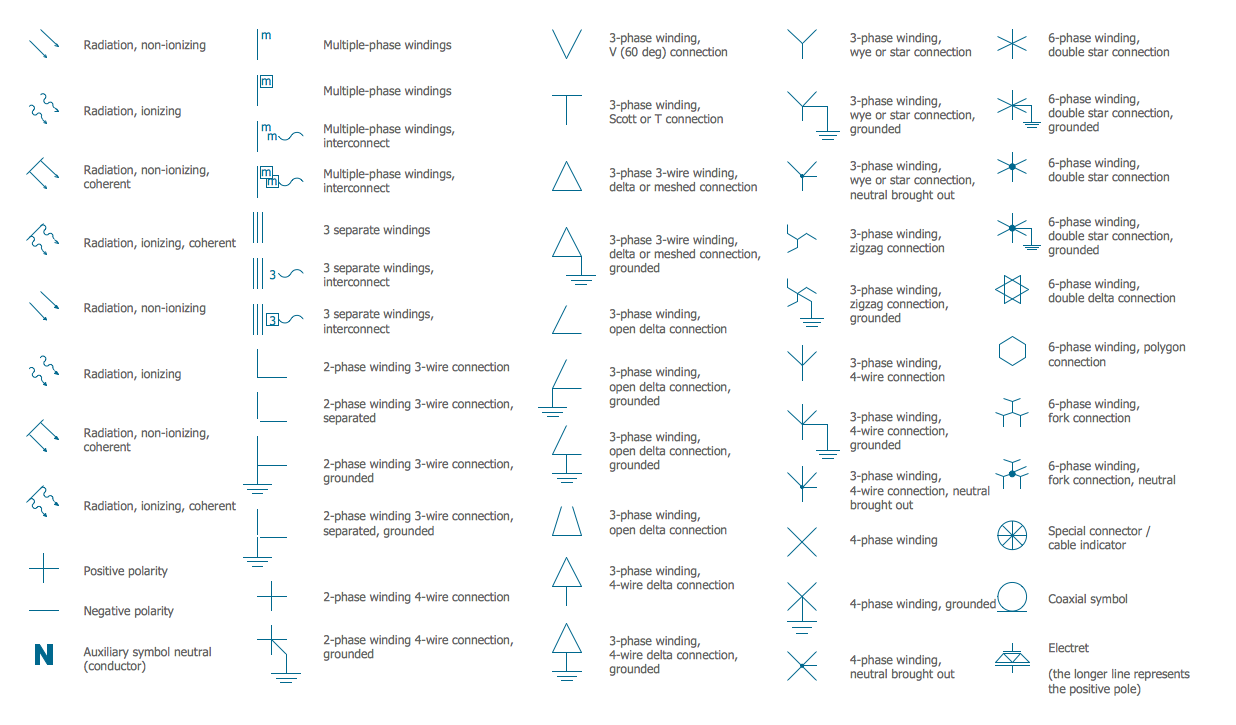
Electrical Symbols — Transformers and Windings
 Meter Dashboard
Meter dashboard solution extends ConceptDraw DIAGRAM software with templates, samples and vector stencils library with meter indicators for drawing visual dashboards showing quantitative data.
TQM Diagram Example

Electrical Symbols — Qualifying
Process Flow Chart Examples

Half Pipe Plans