Structure Chart Generator
A Structure chart is a modular design tool, which shows the breakdown of a system to several manageable levels. As a rule, it is developed in the form of a top-down hierarchical diagram, however, other representations are also acceptable. As a result, the Structure Chart represents the hierarchical structure of functional modules. Each module represents the process or task of the system. Therefore, the chart is also called a Module chart or Hierarchy chart and is similar in appearance to an Organizational chart. It describes functions and sub-functions of each system's module, reflects the size and complexity of the system, and serves as a visual decomposition of a problem into subproblems. The Structure chart is read from top to bottom and left to right.
Structure charts are widely used in different fields: software engineering, structured programming, software development, organizational theory, and many others. An Organization chart of a company is also a Structure chart. It helps to depict a complex company structure. The design of the Structure chart is a universal benefit for any company, but it is especially important for large companies. The Structure chart reflects the chain of command, the hierarchy of the business teams, leaders, managers, and other employees, the span of control, and the centralization of the company. You can oversee employees’ titles and relationships across teams or departments. Show how each role, team, or department fits into the overall picture.
Based on the Structure diagram, you can visualize how the workflows are organized and performed in a company. The Structure diagram is similar to a map reflecting the company's work, the distribution of roles and interactions of employees with each other. It is a real help for business leaders, especially as the company grows and gets bigger. It is also helpful for new employees to learn who manages what processes in the company, who reports to whom, and how decisions are made in the company. A clear understanding of their roles within a company, helps employees to perform their tasks efficiently, manage expectations and goals, and affects the company's success. Depending on the field, size of the business, its goals, and other parameters, the organizational structure of the company and its Structure chart vary.
Being applied in software development, the Structure chart helps to show the architecture of a computer program, arrange program modules into a tree, and show the relationships between modules and data passing. Usually, programmers break down a task on the subtasks that should be performed by the program to solve the problem. Next, these sub-tasks are broken again into smaller tasks, and so on to the smallest parts. The number of modules can differ, sometimes the problem should be broken down into very small components.
There are used different types of modules. Usually, a control module branches to several sub-modules. As a rule, the rectangles show the modules of the system and the lines connecting them show the relationships among the parts. A curved arrow represents a loop in the module that is a repetitive call of the module by the sub-module. One module calls another, passes the defined parameters, and receives results. A library module is reusable and called from any module. A conditional call usually represents the choice of the called sub-module based on the defined condition.
The different types of Structure diagrams exist, these are transform-centered structures, transaction-centered structures, company structure charts, governance charts, management charts, and many others.
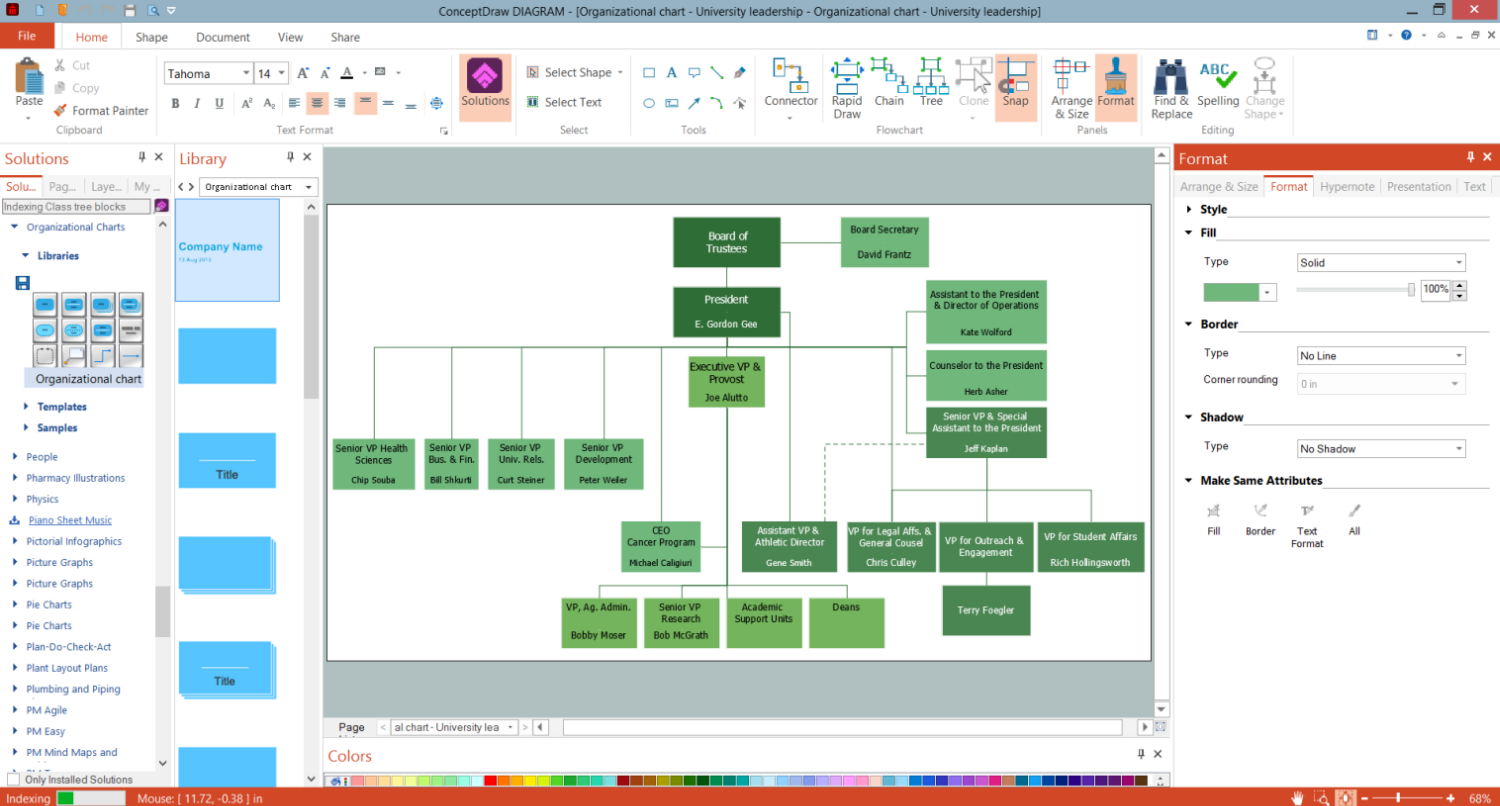
Example 1. Structure Chart Generator - ConceptDraw DIAGRAM
Construct your clear and especially-looking Structure chart, visually break down a problem into parts, or reflect the architecture of a projected computer program easily and quickly in structure chart generator ConceptDraw DIAGRAM. And don't forget to update your Structure chart if the current structure changes. Start inspired with predesigned samples included in ConceptDraw's Organisational Charts solution. Use any of them as a template to get started and simply edit it. Save time and effort with an intuitive application interface, powerful drawing tools, and a variety of pre-made graphics, design elements — organizational chart, and symbols from the solution library.

Example 2. Organizational Chart Library Design Elements
The following features make ConceptDraw DIAGRAM the best Structure Chart Generator:
- You don't need to be an artist to draw professional-looking diagrams in a few minutes.
- Large quantity of ready-to-use vector objects makes your drawing diagrams quick and easy.
- Great number of predesigned templates and samples give you the good start for your own diagrams.
- ConceptDraw DIAGRAM provides you the possibility to use the grid, rules and guides. You can easily rotate, group, align, arrange the objects, use different fonts and colors to make your diagram exceptionally looking.
- All ConceptDraw DIAGRAM documents are vector graphic files and are available for reviewing, modifying, and converting to a variety of formats: image, HTML, PDF file, MS PowerPoint Presentation, Adobe Flash, MS Visio.
- Using ConceptDraw STORE you can navigate through ConceptDraw Solution Park, managing downloads and updates. You can access libraries, templates and samples directly from the ConceptDraw STORE.
- If you have any questions, our free of charge support is always ready to come to your aid.
TEN RELATED HOW TO's:
Accounting is a cornerstone of any business, it’s basement. If you want to have a visual representation of your finance management, use audit flowchart symbols to document the money flow. Although some would say that accounting is boring, it is very a responsible duty.
The audit flowchart symbols is supplied with ConceptDraw Audit Flowcharts solution as a vector objects library. Together with Conceptdraw Drawing capabilities it forms the helpful tool for audit process planning and setting the steps of audit by designing audit flow charts. Audit Flow charts are used to organize fiscal information tracking process as well as in accounting, finance and investment management.
Picture: Audit Flowchart Symbols
Related Solution:
Data structure diagram (DSD) is intended for description of conceptual models of data (concepts and connections between them) in the graphic format for more obviousness. Data structure diagram includes entities description, connections between them and obligatory conditions and requirements which connect them. Create Data structure diagram with ConceptDraw DIAGRAM.
Picture: Data structure diagram with ConceptDraw DIAGRAM
Diagramming is an astonishing way to visualize business processes. The list of the most common business process flowchart symbols is quite long starting from basic flowcharts, continuing with SIPOC diagrams. Business process modeling was never easier than now, with special ConceptDraw Business Process Mapping solution.
To carry out all professional standard requirements for business processes mapping, it is necessarily to follow the special graphical notations. ConceptDraw Business Process Mapping solution offers an exhaustive suite of tools to aid business process mapping. There are three vector libraries SIPOC Diagrams, Business Process Flowcharts, and Swim Lanes that contains totally more than 50 symbols of standard BPM notations. This is all that professionals need to effectively evaluate and manage quality in business processes.
Picture: Business Process Flowchart Symbols
Related Solution:
If you need to describe some process, diagramming is a perfect tool for almost any imaginable purpose. The set of the most commonly used flow charts symbols is quite wide and includes symbols for operations, processes, data inputs and outputs. You can see the full list of all the symbols used for flowcharting in Flowcharts solution from Diagrams area in ConceptDraw Solution Park.
A flow chart is often used for visual representation of a sequential process flow. The flowchart approach to any process is to divide it into some sequential actions. What makes a flow chart so popular and clear to make out is the set of standard flowchart symbols that has the same reading independently from processes described with their applying. The current drawing represents the vector library containing the pack of standard flowchart symbols. This library is supplied with ConceptDraw Flowcharts solution.
Picture: Flow Chart Symbols
Related Solution:
A flowchart is a simple but very functional tool when it comes to understanding a workflow or to removing unnecessary stages from a process. When drawing flowcharts, keep in mind that there are four common types of flowcharts, like document flowcharts and data flowcharts that show control over a data or document flow over a system. To show controls on a physical level, use system flowcharts. In addition, to show controls in a program, you can draw a program flowchart.
This flowchart diagram represents the piece of an article editing process, that involves the author and editor. It was created using the Basic Flowchart notation that consists from the basic flowchart symbols. The start and the end of the process are indicated with "Terminator" symbols. The "Process" symbols show the action steps consisting from making edits and searching for a compromise, when the author does not agree with the suggestions of the editor. The "Process" symbol is the general symbol in process flowcharts. The "Decision" symbol indicates a branching in the process flow. There are two branches indicated by a Decision shape in the current flowchart (Yes/No, Disagree/Agree). This basic flowchart can be used as a repeating unit in the workflow diagram describing the working process of some editorial office.
Picture: Types of Flowcharts
Related Solution:
Use ConceptDraw DIAGRAM diagramming and business graphics software to draw your own flowcharts of computer algorithms.
Picture: Process Flow app for macOS
Related Solution:
The ConceptDraw Flowchart component includes a set of samples and templates. This geathered as flowchart maker toolbox which focused on drawing flowcharts of any industry standards.
Picture: Flowchart Components
Related Solution:
Data flow diagrams are the graphical tool, used in the visualization of data flow of some data processing systems. It is the valuable process modeling tool. Also designing DFD is the important component of the initial part of any information system development project. The standard symbols are used to represent the interaction of a system components and how various kinds of components influence on data flow. The ConceptDraw Data Flow Diagrams solution is design to assist professional software engineers in making DFDs according to Gane and Sarson, and Yourdon and Coad notations.
Do you imagine yourself as a successful IT specialist? To your mind, they all use data flow diagram examples to learn and to get inspired. Aren’t you still with us?
Picture: Data Flow Diagram Examples
Related Solution:
ConceptDraw DIAGRAM is a world-class diagramming platform that lets you display, communicate, and present dynamically. It′s powerful enough to draw everything from basic flowcharts to complex engineering schematics.
Video tutorials on ConceptDraw products. Try it today!
Picture: Business Process Mapping — How to Map a Work Process
Related Solutions:
Event-Driven Process Chain Diagrams for improvement throughout an organisation.
ConceptDraw DIAGRAM - software that reduces the time needed to create a business process model.
Picture: Graphical Symbols to use in EPC diagrams
Related Solution:
