TEN RELATED HOW TO's:
State Diagram UML of Online Store. This sample was created in ConceptDraw DIAGRAM diagramming and vector drawing software using the UML Class Diagram library of the Rapid UML Solution from the Software Development area of ConceptDraw Solution Park.
This sample shows the work of the medical shop and is used at the creation of the medical shop or pharmacy project, for understanding the process of shopping in the medical shop, for keeping purchases, for medical supplies.
Picture: UML Class Diagram Example - Medical Shop
Related Solution:
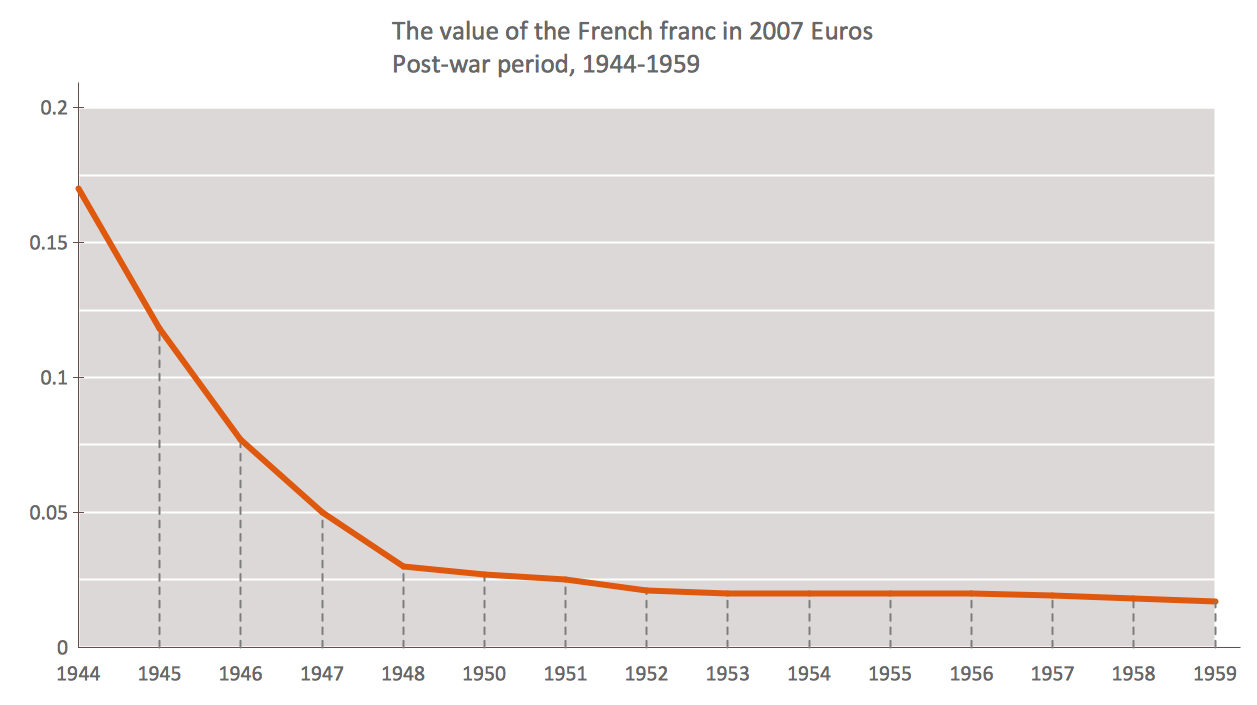
The Line Graphs solution from Graphs and Charts area of ConceptDraw Solution Park contains a set of examples, templates and design elements library of line and scatter charts. Use it to draw line and scatter graphs using ConceptDraw DIAGRAM diagramming and vector drawing software for illustrating your documents, presentations and websites.
Picture: Line Chart Examples
Related Solution:
ConceptDraw DIAGRAM creates drawings, diagrams and charts with great visual appeal in MacOS
Picture: Percentage Spider Chart
Related Solution:
Learn the most common process flowchart symbols used in business process diagrams and workflow charts. Includes symbol meanings, examples, and a practical reference table.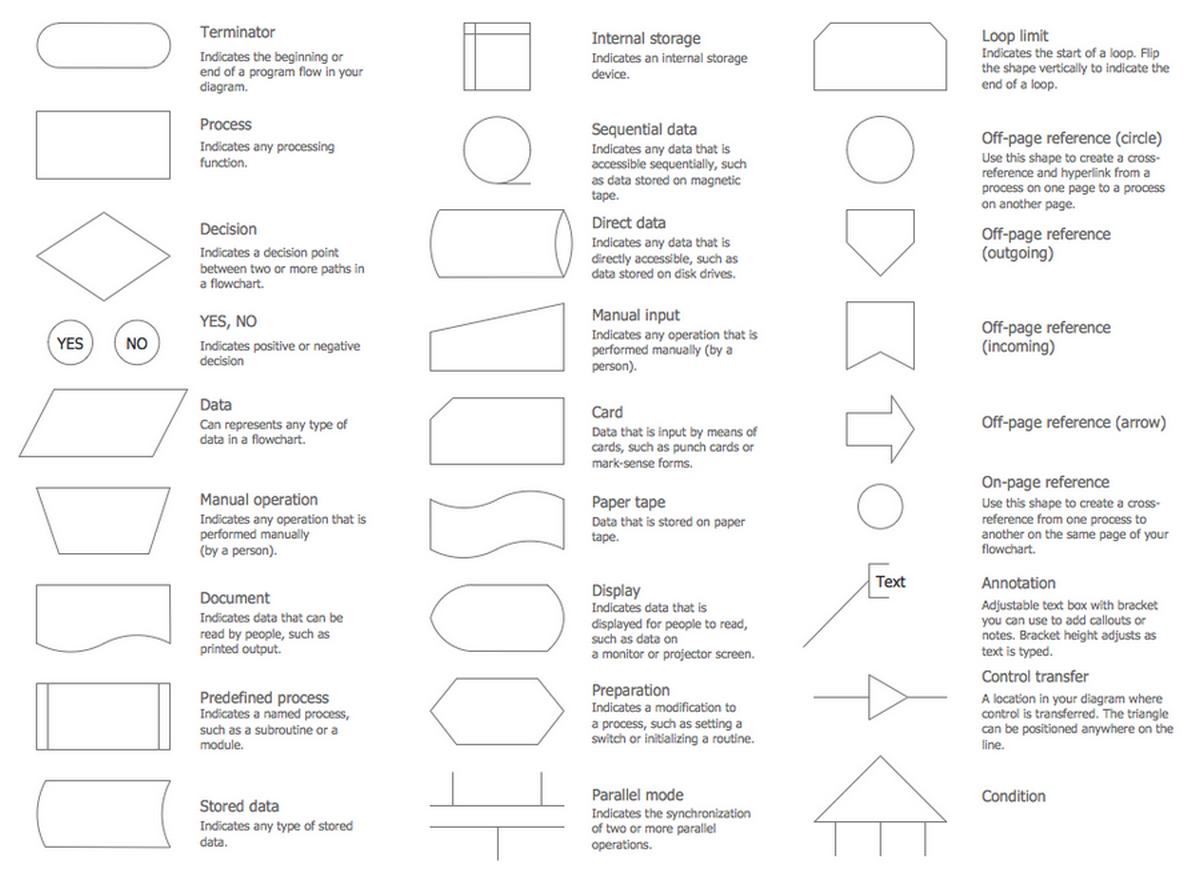
Picture: Process Flowchart Symbols: Meaning, Types and Examples
Related Solution:
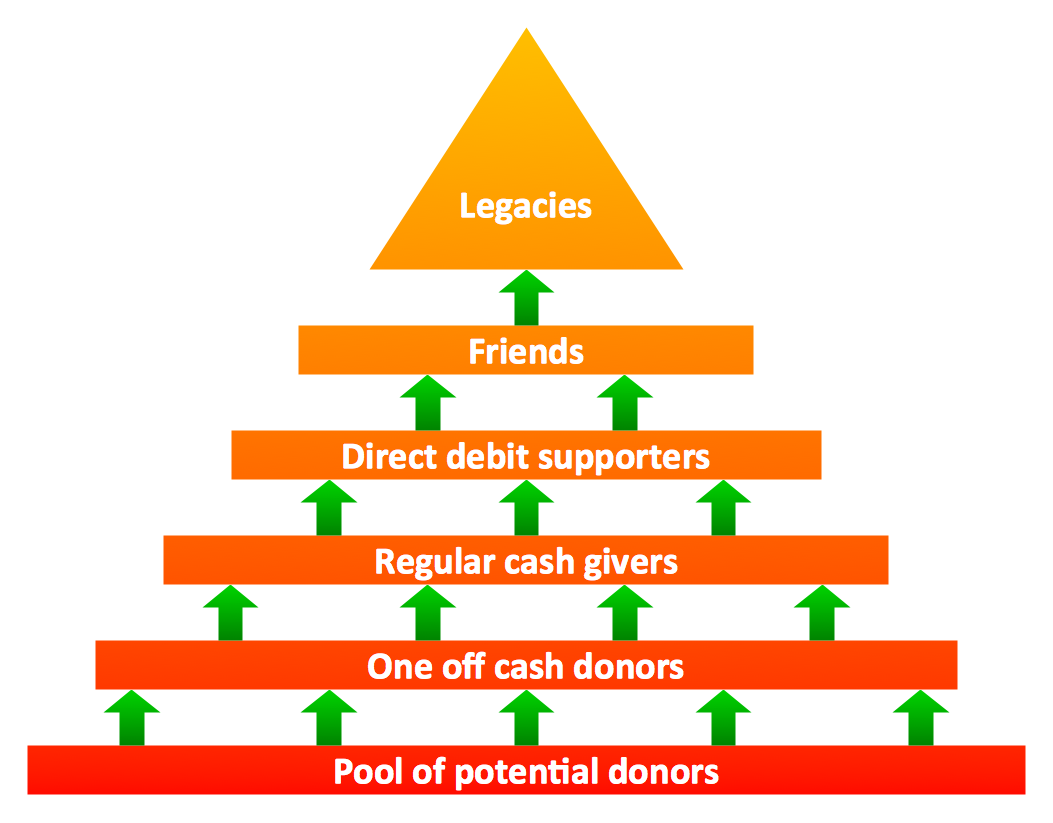
Triangle diagram example of DIKW pyramid has 4 levels: data, information, knowledge and wisdom.
Picture: Pyramid Diagram
Related Solutions:
ConceptDraw DIAGRAM is the professional business graphic software for drawing diagrams and charts with great visual appeal on Mac OS X.
Picture: The Best Drawing Program for Mac
Related Solution:
The ConceptDraw Flowchart component includes a set of samples and templates. This geathered as flowchart maker toolbox which focused on drawing flowcharts of any industry standards.
Picture: Flowchart Components
Related Solution:
Try ConceptDraw program, the perfect drawing tool for creating all kinds of great-looking drawings, charts, graphs, and illustrations.
Picture: Basic Diagramming
Related Solution:
You need design the seating chart? The simple way is to use the specialized software. ConceptDraw DIAGRAM diagramming and vector drawing software extended with Seating Plans solution from the Building Plans area with powerful drawing tools, samples, seating chart template free will be ideal for you.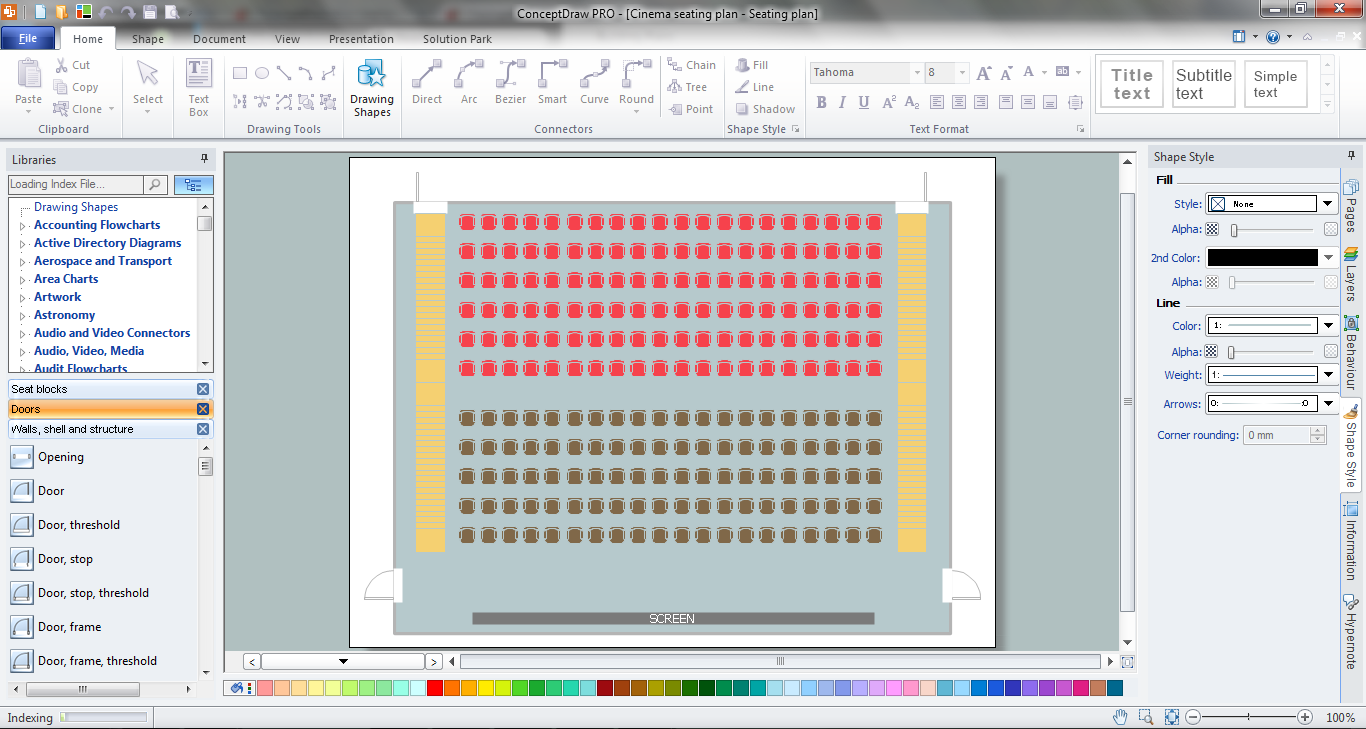
Picture: Seating Chart Template Free
Related Solution:
This sample was created in ConceptDraw DIAGRAM diagramming and vector drawing software using the Bar Graphs Solution from Graphs and Charts area of ConceptDraw Solution Park. It is Bar Graphs example, Sales Growth example, Column Chart Example - Sales Report.
Picture: Sales Growth. Bar Graphs Example
Related Solution:
 Pie Chart
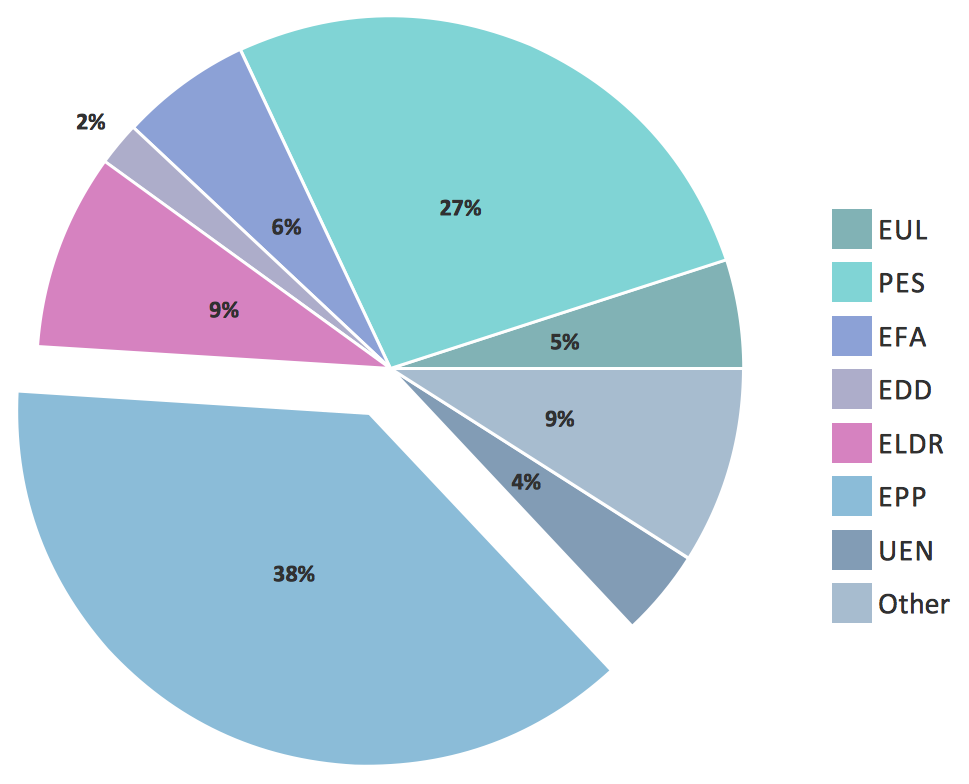 Exploded Pie Chart
 Percentage Pie Chart
 Donut Chart
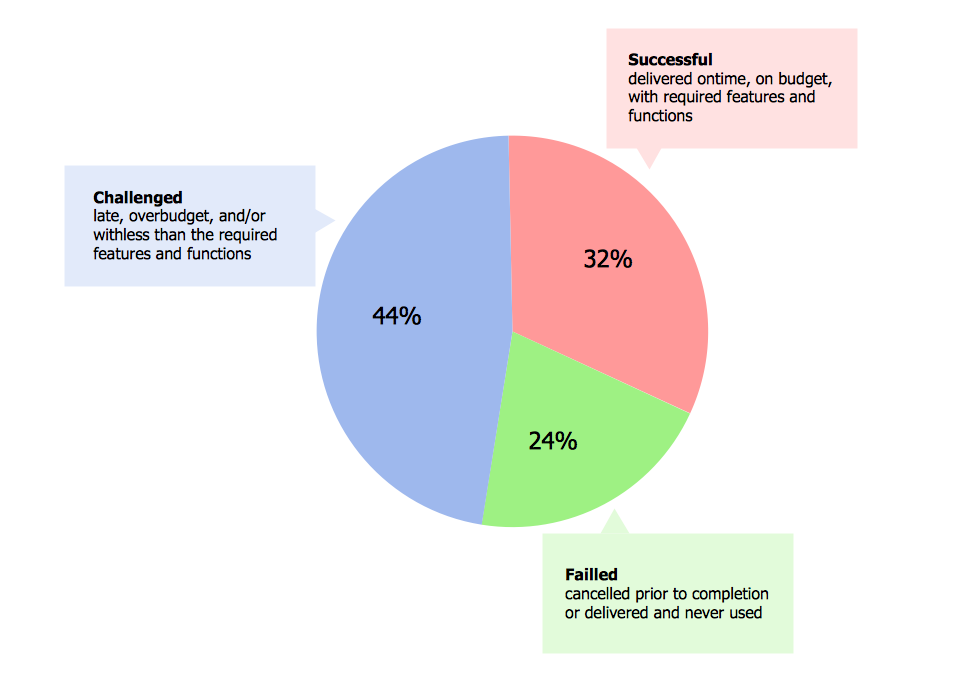 Percentage Pie Chart
 Column Chart
 3D Column Chart
 Cylindrical Column Chart
 Line Graph - Anual Percentage Change
 Line Graph -
 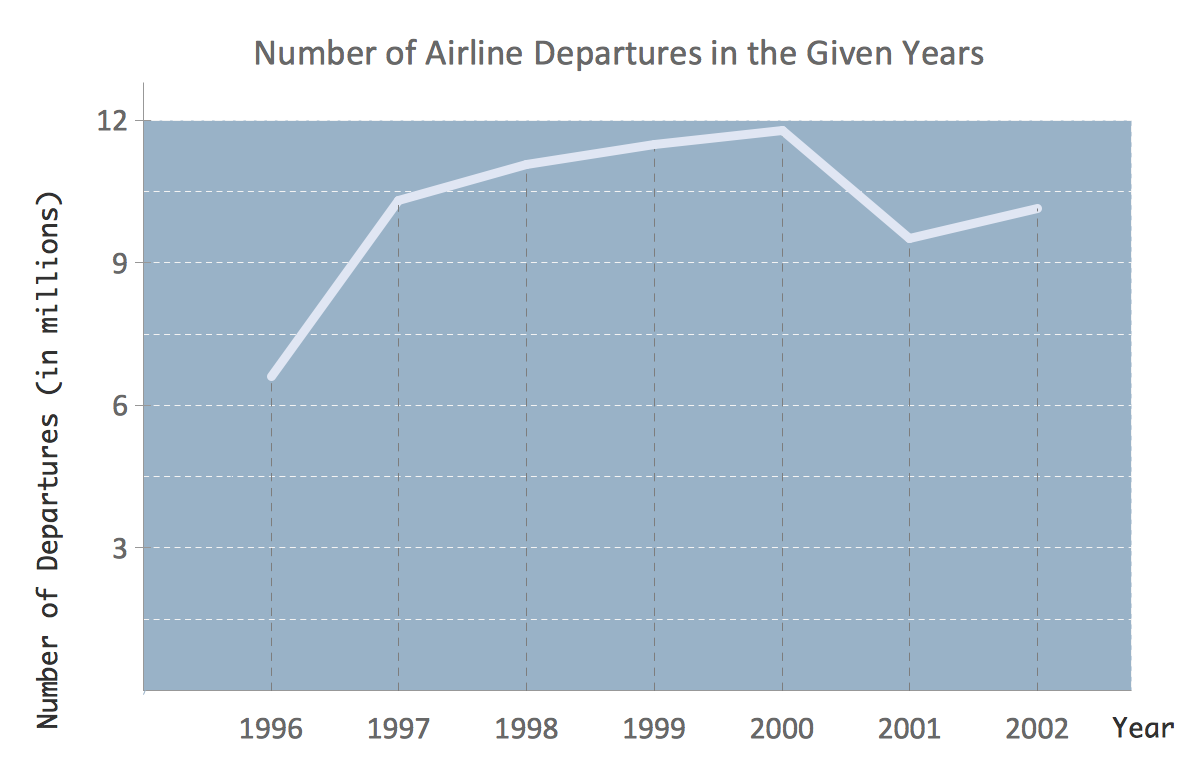 Line Graph -
 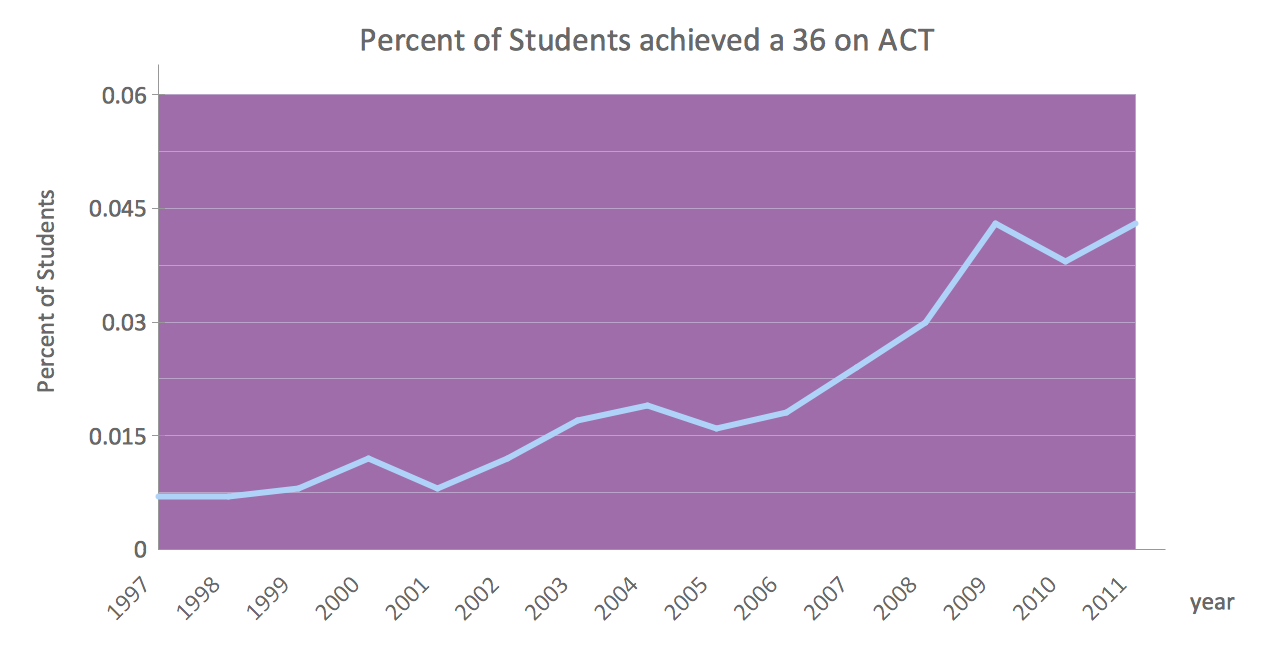 Line Graph - Anual Percentage Change
 Line Graph -
  Double Bar Chart
 Horizontal Bar Chart
 Vertical Bar Chart


 Scatter Chart
 Scatter Chart
 Scatter Chart
