Venn Diagram Examples for Problem Solving. Environmental Social Science. Human Sustainability Confluence

This Venn diagram sample depicts the path to sustainable development.
"Sustainable development is an organizing principle for human life on a finite planet. It posits a desirable future state for human societies in which living conditions and resource-use meet human needs without undermining the sustainability of natural systems and the environment, so that future generations may also have their needs met.
Sustainable development ties together concern for the carrying capacity of natural systems with the social and economic challenges faced by humanity. As early as the 1970s, 'sustainability' was employed to describe an economy "in equilibrium with basic ecological support systems." Scientists in many fields have highlighted The Limits to Growth, and economists have presented alternatives, for example a 'steady state economy', to address concerns over the impacts of expanding human development on the planet." [Sustainable development. Wikipedia]
The Venn diagram example "Path to sustainable development" was created using the ConceptDraw PRO diagramming and vector drawing software extended with the Venn Diagrams solution from the area "What is a Diagram" of ConceptDraw Solution Park.
Venn diagram

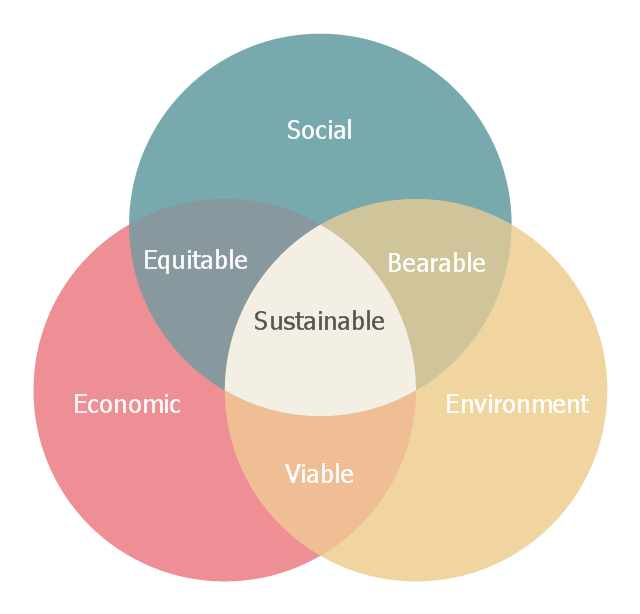
This Venn diagram sample shows the sustainable development at the confluence of three constituent parts: social, economic and environment. It was designed on the base of the Wikimedia Commons file: Sustainable development.svg.
[commons.wikimedia.org/ wiki/ File:Sustainable_ development.svg]
This file is licensed under the Creative Commons Attribution-Share Alike 3.0 Unported license. [creativecommons.org/ licenses/ by-sa/ 3.0/ deed.en]
"Sustainable development is an organizing principle for human life on a finite planet. It posits a desirable future state for human societies in which living conditions and resource-use meet human needs without undermining the sustainability of natural systems and the environment, so that future generations may also have their needs met.
Sustainable development ties together concern for the carrying capacity of natural systems with the social and economic challenges faced by humanity. " [Sustainable development. Wikipedia]
The Venn diagram example "Sustainable development" was created using the ConceptDraw PRO diagramming and vector drawing software extended with the Venn Diagrams solution from the area "What is a Diagram" of ConceptDraw Solution Park.
Venn diagram
Cylinder Venn Diagram

Venn Diagram

PROBLEM ANALYSIS. Relations Diagram


How To Create Home Plan with Examples


Best Value — Total Quality Management

Basic Diagramming Flowchart Software

Simple Flow Chart

Improving Problem Solving and Focus with Fishbone Diagrams

Bar Diagrams for Problem Solving. Create business management bar charts with Bar Graphs Solution

HR Flowchart Symbols

Bar Diagrams for Problem Solving. Create manufacturing and economics bar charts with Bar Graphs Solution

Object-Oriented Development (OOD) Method
 Method *")
Using Fishbone Diagrams for Problem Solving

Flow Chart Creator

Venn Diagram Examples for Problem Solving

How to Design a Good Workflow

SDL Flowchart Symbols

- Path to sustainable development | Venn Diagrams | Sustainability ...
- Sustainable development | Venn Diagram | Path to sustainable ...
- Path to sustainable development | Venn Diagram Examples for ...
- Sustainable Venn Diagram
- Sustainable development | Venn Diagrams | Photo Of Sustainable ...
- Sustainable development | Path to sustainable development | Venn ...
- Sustainability Venn Diagram Examples
- Path to sustainable development | Sustainable development | Venn ...
- Venn diagram - Path to sustainable development | Sustainable ...
- Venn Diagrams | Community elements overlapping | Path to ...
- Path to sustainable development | Leadership and data | Venn ...
- Venn Diagrams | Pie Chart On Sustainable Development
- Principle On Human Development In Venn Diagram
- Sustainable development | Path to sustainable development ...
- Bar Graph | Venn Diagram Examples for Problem Solving ...
- Venn Diagram Of Growth And Development
- Venn Diagrams | Graph On Sustainable Development
- Sustainable development | Venn Diagram
- Path to sustainable development | How to Draw Business Process ...