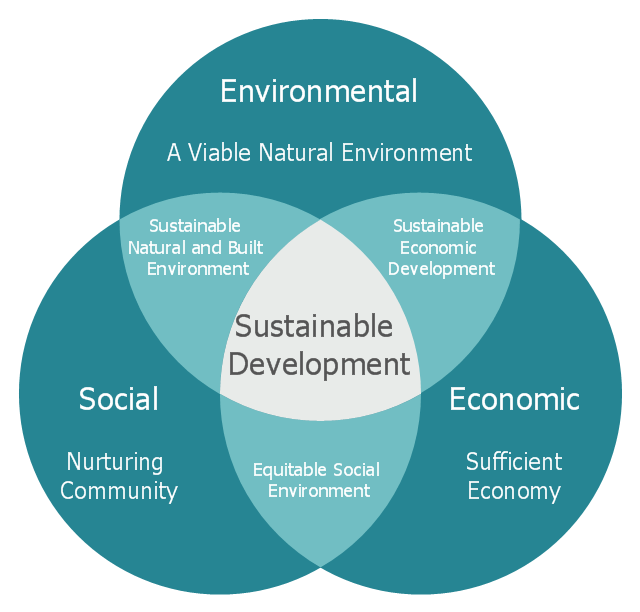
"Sustainable development is an organizing principle for human life on a finite planet. It posits a desirable future state for human societies in which living conditions and resource-use meet human needs without undermining the sustainability of natural systems and the environment, so that future generations may also have their needs met.
Sustainable development ties together concern for the carrying capacity of natural systems with the social and economic challenges faced by humanity. As early as the 1970s, 'sustainability' was employed to describe an economy "in equilibrium with basic ecological support systems." Scientists in many fields have highlighted The Limits to Growth, and economists have presented alternatives, for example a 'steady state economy', to address concerns over the impacts of expanding human development on the planet." [Sustainable development. Wikipedia]
The Venn diagram example "Path to sustainable development" was created using the ConceptDraw PRO diagramming and vector drawing software extended with the Venn Diagrams solution from the area "What is a Diagram" of ConceptDraw Solution Park.
Venn diagram
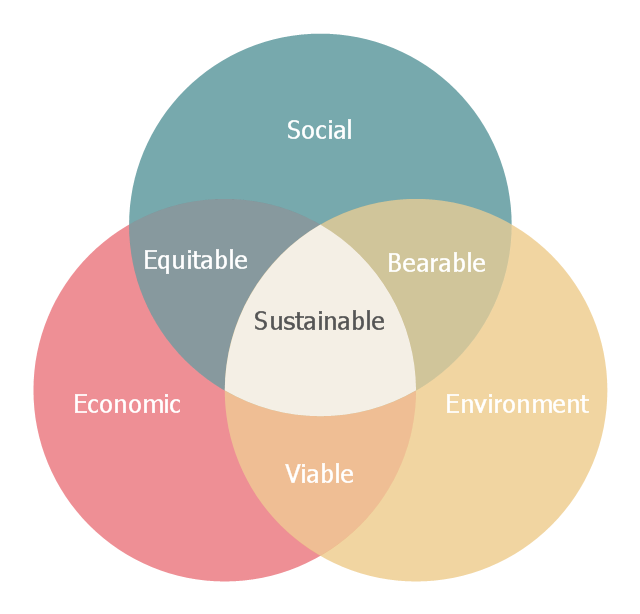
Venn diagram of sustainable development: at the confluence of three constituent parts.
This Venn diagram example was redesigned from the Wikimedia Commons file: Sustainable development.svg.
[commons.wikimedia.org/ wiki/ File:Sustainable_ development.svg]
This file is licensed under the Creative Commons Attribution-Share Alike 3.0 Unported license. [creativecommons.org/ licenses/ by-sa/ 3.0/ deed.en]
"Sustainable development is an organizing principle for human life on a finite planet. It posits a desirable future state for human societies in which living conditions and resource-use meet human needs without undermining the sustainability of natural systems and the environment, so that future generations may also have their needs met.
Sustainable development ties together concern for the carrying capacity of natural systems with the social and economic challenges faced by humanity. " [Sustainable development. Wikipedia]
The Venn diagram example "Sustainable development" was created using the ConceptDraw PRO diagramming and vector drawing software extended with the Venn Diagrams solution from the area "What is a Diagram" of ConceptDraw Solution Park.
Venn diagram
"Sustainable development is an organizing principle for human life on a finite planet. It posits a desirable future state for human societies in which living conditions and resource-use meet human needs without undermining the sustainability of natural systems and the environment, so that future generations may also have their needs met.
Sustainable development ties together concern for the carrying capacity of natural systems with the social and economic challenges faced by humanity. As early as the 1970s, 'sustainability' was employed to describe an economy "in equilibrium with basic ecological support systems." Scientists in many fields have highlighted The Limits to Growth, and economists have presented alternatives, for example a 'steady state economy', to address concerns over the impacts of expanding human development on the planet." [Sustainable development. Wikipedia]
The Venn diagram example "Path to sustainable development" was created using the ConceptDraw PRO diagramming and vector drawing software extended with the Venn Diagrams solution from the area "What is a Diagram" of ConceptDraw Solution Park.
Venn diagram
Venn Diagram Examples for Problem Solving. Environmental Social Science. Human Sustainability Confluence

Create your Venn diagrams for problem solving in environmental social science using the ConceptDraw PRO diagramming and vector drawing software extended with the Venn Diagrams solution from the area "What is a Diagram" of ConceptDraw Solution Park.
Venn Diagram

 Venn Diagrams
Venn Diagrams are actively used to illustrate simple set relationships in set theory and probability theory, logic and statistics, mathematics and computer science, linguistics, sociology, and marketing. Venn Diagrams are also often used to visually summarize the status and future viability of a project.
Venn Diagrams

ConceptDraw PRO diagramming and vector drawing software extended with Venn Diagrams solution from "What is a Diagram" area offers set of useful drawing tools for easy creating the Venn Diagrams for any quantity of sets.
Venn Diagram Examples for Problem Solving. Computer Science. Chomsky Hierarchy

The Venn diagram example below visualizes the the class of language inclusions described by the Chomsky hierarchy.
Venn Diagram Examples for Problem Solving. Venn Diagram as a Truth Table

Fishbone Diagram Problem Solving

To design easily the Fishbone diagram, you can use a special ConceptDraw PRO vector graphic and diagramming software which contains the powerful tools for Fishbone diagram problem solving offered by Fishbone Diagrams solution for the Management area of ConceptDraw Solution Park.
PROBLEM ANALYSIS. Root Cause Analysis Tree Diagram

ConceptDraw Office suite is a software for problem analysis.

- Venn diagram - Path to sustainable development | Venn Diagram ...
- Venn diagram - Path to sustainable development | Sustainable ...
- Venn diagram - Path to sustainable development | Software ...
- Venn diagram - Path to sustainable development | Matrices | Line ...
- Sustainable development - Venn diagram
- Venn diagram - Path to sustainable development
- Venn diagram - Path to sustainable development | Venn diagrams ...
- Venn diagram - Path to sustainable development | Sustainable ...
- ConceptDraw Solution Park | Process Flowchart | Venn Diagrams ...
- Blog Diagram On Sustainable Development
- Venn diagram - Path to sustainable development | Venn Diagram ...
- Software development with ConceptDraw Products | Venn diagram ...
- Sustainable development - Venn diagram | Venn diagram - Path to ...
- Block Diagrams On Sustainable Development
- Venn Diagram | Sustainable Development Illustrations
- Principle Of Sustainable Development By Block Diqgram
- Venn diagram - Path to sustainable development | Object-Oriented ...
- Pie Chart On Sustainable Development
- Venn Diagrams | Venn Diagram | 5-Set Venn diagram - Template ...
- Venn Diagrams | Data Analysies For Sustainable Development