Scatter Plot

The vector stencils library "Scatterplot" contains 8 scatter diagram templates.
Use to design your scatter graphs with ConceptDraw PRO diagramming and vector drawing software.
"A scatter plot, scatterplot, or scattergraph is a type of mathematical diagram using Cartesian coordinates to display values for typically two variables for a set of data. If the points are color-coded you can increase the number of displayed variables to three.
The data is displayed as a collection of points, each having the value of one variable determining the position on the horizontal axis and the value of the other variable determining the position on the vertical axis. This kind of plot is also called a scatter chart, scattergram, scatter diagram, or scatter graph. ...
The scatter diagram is one of the seven basic tools of quality control." [Scatter plot. Wikipedia]
The example of scatter chart templates "Design elements - Scatterplot" is included in the Seven Basic Tools of Quality solution from the Quality area of ConceptDraw Solution Park.
Scatter graph templates
Blank Scatter Plot

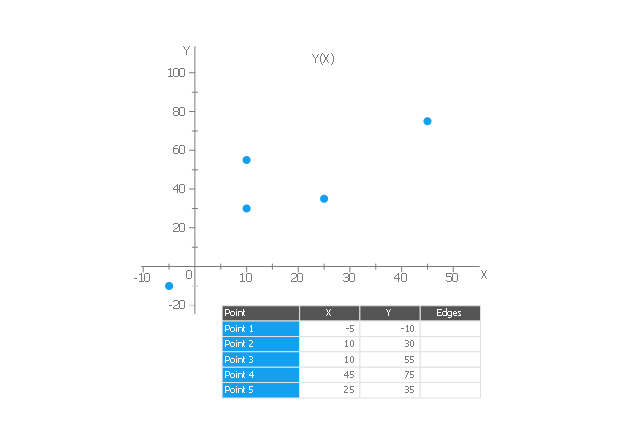
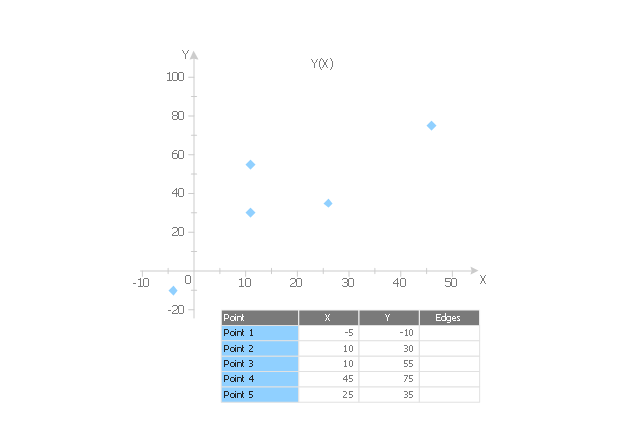
Use this template to design your scatter charts.
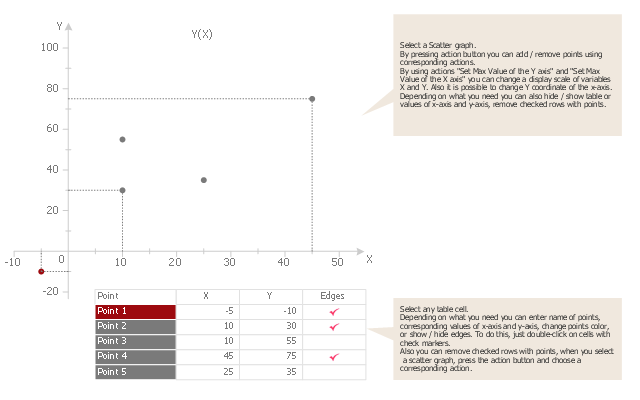
"A scatter plot, scatterplot, or scattergraph is a type of mathematical diagram using Cartesian coordinates to display values for two variables for a set of data.
The data is displayed as a collection of points, each having the value of one variable determining the position on the horizontal axis and the value of the other variable determining the position on the vertical axis. This kind of plot is also called a scatter chart, scattergram, scatter diagram, or scatter graph." [Scatter plot. Wikipedia]
The template "Scatter graph" for the ConceptDraw PRO diagramming and vector drawing software is included in the Scatter Diagrams solution from the Graphs and Charts area of ConceptDraw Solution Park.
Template
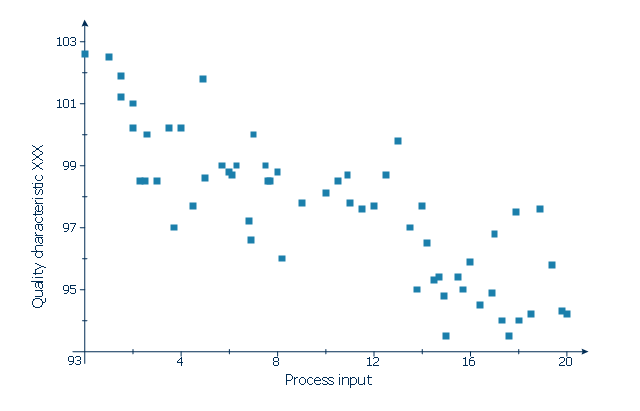
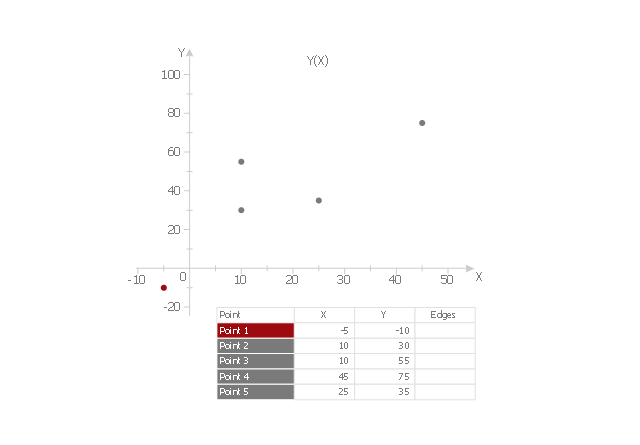
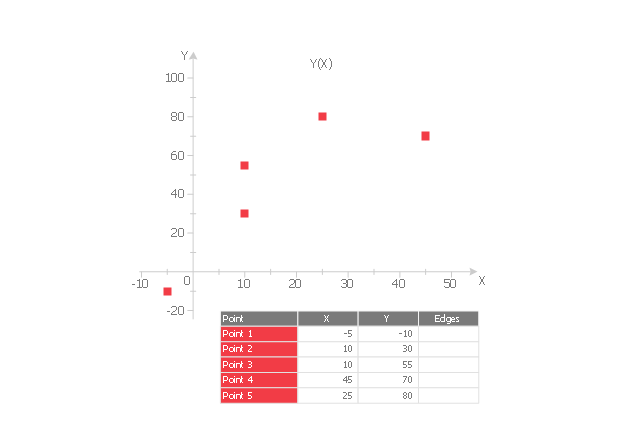
This scatter graph (scattergraph. scatter chart, scatter plot, scatterplot, scatter diagram) example depicts quality characteristic vs. process input. It was designed on the base of the Wikimedia Commons file: Scatter diagram for quality characteristic XXX.svg. [commons.wikimedia.org/ wiki/ File:Scatter_ diagram_ for_ quality_ characteristic_ XXX.svg]
This file is licensed under the Creative Commons Attribution-Share Alike 3.0 Unported license. [creativecommons.org/ licenses/ by-sa/ 3.0/ deed.en]
"Scatterplots are used to graphically display the relationship between two variables. They are commonly used to accompany correlational analyses." [Scatterplot. Wikiversity]
The scatter chart example "Quality characteristic XXX" was created using the ConceptDraw PRO diagramming and vector drawing software extended with the Scatter Diagrams solution from the Graphs and Charts area of ConceptDraw Solution Park.
Scatter chart
Scatter Chart Examples

Use it to draw scatter graphs using ConceptDraw PRO diagramming and vector drawing software for illustrating your documents, presentations and websites.
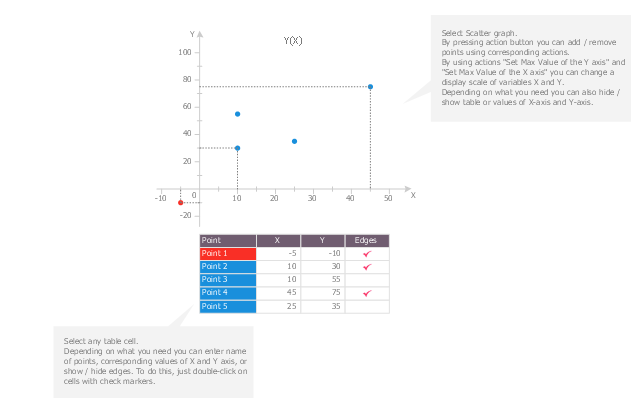
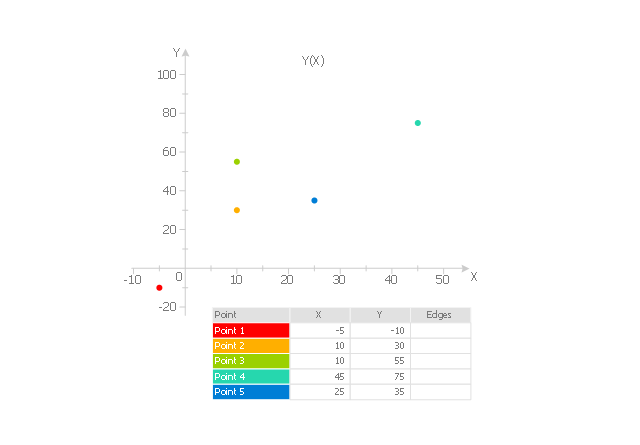
Use this scatter plot template to show values for two variables for your data series in ConceptDraw PRO diagramming and vector drawing software.
"A scatter plot, scatterplot, or scattergraph is a type of mathematical diagram using Cartesian coordinates to display values for two variables for a set of data.
The data is displayed as a collection of points, each having the value of one variable determining the position on the horizontal axis and the value of the other variable determining the position on the vertical axis. This kind of plot is also called a scatter chart, scattergram, scatter diagram, or scatter graph." [Scatter plot. Wikipedia]
The chart template "Scatter graph" is included in the Basic Scatter Diagrams solution from the Graphs and Charts area of ConceptDraw Solution Park.
Template
The vector stencils library "Scatter graphs" contains 7 templates of scatter diagrams (scattergraphs, scatter charts, scatter plots, scatterplots, scatter diagrams) for visual analysis of correlation between two variables.
Use these shapes to draw your scatterplots in the ConceptDraw PRO diagramming and vector drawing software.
The vector stencils library "Scatter graphs" is included in the Scatter Diagrams solution of the Graphs and Charts area in ConceptDraw Solution Park.
Use these shapes to draw your scatterplots in the ConceptDraw PRO diagramming and vector drawing software.
The vector stencils library "Scatter graphs" is included in the Scatter Diagrams solution of the Graphs and Charts area in ConceptDraw Solution Park.
Scatter graph 1
Scatter graph 2
Scatter graph 3
Scatter graph 4
Scatter graph 5
Scatter graph 6
Scatter graph - serial
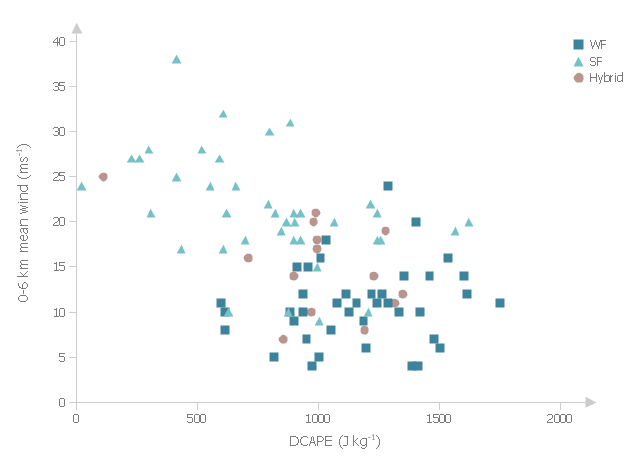
This example was drawn on the base of fig. 13 "Scatter plot of DCAPE versus 0-6 km mean wind" from the article "Examination of Derecho Environments Using Proximity Soundings" by Jeffry S. Evans on the website of Storm Prediction Center, National Oceanic and Atmospheric Administration.
"Figure 13 suggests the existence of an inverse relationship between DCAPE and mean wind when considering all derechos. Careful examination of this figure shows that this is the result of the separation into SF, WF, and hybrid categories; the SF cases are found in the upper left part of the figure, the WF cases are found in the lower right part, and the hybrid cases are in between, with some hint that they are more like the WF cases than the SF cases." [spc.noaa.gov/ publications/ evans/ bowpaper/ bowpaper.htm]
"In stratified sampling, the population is partitioned into non-overlapping groups, called strata and a sample is selected by some design within each stratum. ...
The principal reasons for using stratified random sampling rather than simple random sampling include:
1. Stratification may produce a smaller error of estimation than would be produced by a simple random sample of the same size. This result is particularly true if measurements within strata are very homogeneous.
2. The cost per observation in the survey may be reduced by stratification of the population elements into convenient groupings.
3. Estimates of population parameters may be desired for subgroups of the population. These subgroups should then be identified." [onlinecourses.science.psu.edu/ stat506/ node/ 27]
The multiserial scatterplot "Starification diagram example" was created using the ConceptDraw PRO software extended with the Seven Basic Tools of Quality solution from the Quality area of ConceptDraw Solution Park.
Multiserial scatterplot
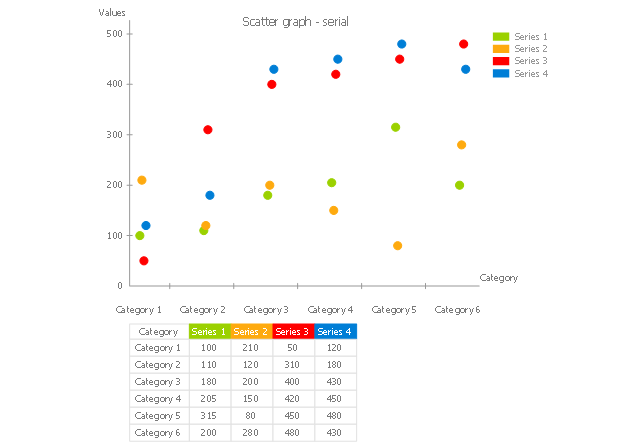
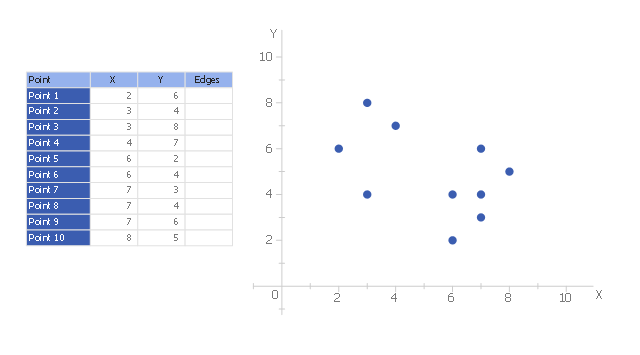
This scatter plot sample is used to illustrate the k-medoid clustering algorithm.
"The k-medoids algorithm is a clustering algorithm related to the k-means algorithm and the medoidshift algorithm. Both the k-means and k-medoids algorithms are partitional (breaking the dataset up into groups) and both attempt to minimize the distance between points labeled to be in a cluster and a point designated as the center of that cluster." [en.wikipedia.org/ wiki/ K-medoids]
The scatterplot example "k-Medoid clustering" was created using the ConceptDraw PRO diagramming and vector drawing software extended with the Basic Scatter Diagrams solution from the Graphs and Charts area of ConceptDraw Solution Park.
Scatterplot
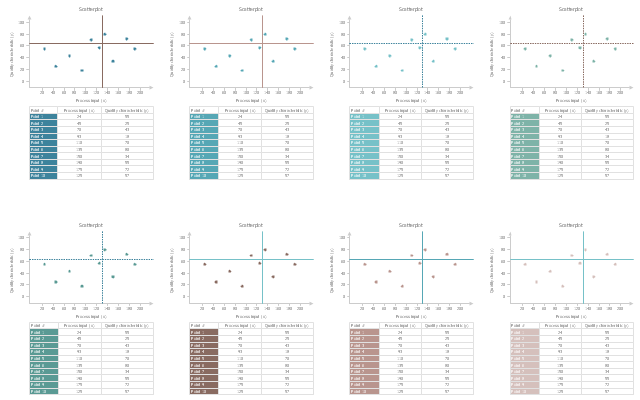
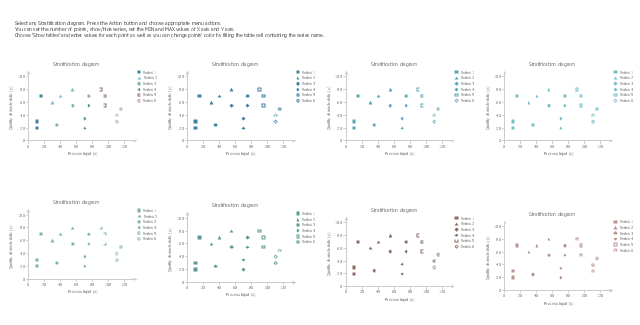
The vector stencils library "Stratification diagram" contains 8 multiseries scatterplot templates.
Use it to design your stratification diagrams with ConceptDraw PRO diagramming and vector drawing software.
"In statistics, stratified sampling is a method of sampling from a population.
In statistical surveys, when subpopulations within an overall population vary, it is advantageous to sample each subpopulation (stratum) independently. Stratification is the process of dividing members of the population into homogeneous subgroups before sampling. The strata should be mutually exclusive: every element in the population must be assigned to only one stratum. The strata should also be collectively exhaustive: no population element can be excluded. Then simple random sampling or systematic sampling is applied within each stratum. This often improves the representativeness of the sample by reducing sampling error. It can produce a weighted mean that has less variability than the arithmetic mean of a simple random sample of the population." [Stratified sampling. Wikipedia]
The stratification is one of the Seven Basic Tools of Quality. [Seven Basic Tools of Quality. Wikipedia]
The example of multiseries scatterplot templates "Design elements - Stratification diagram" is included in the Seven Basic Tools of Quality solution from the Quality area of ConceptDraw Solution Park.
Multiseries scatterplot templates
Scatter Graph Charting Software

The vector stencils library "Education charts" contains 12 graphs and charts: area chart, column chart, divided bar diagram, histogram, horizontal bar graph, line graph, pie chart, ring chart, scatter plot.
Use it to create your education infogram in the ConceptDraw PRO diagramming and vector drawing software.
The vector stencils library "Education charts" is included in the Education Infographics solution from the Business Infographics area of ConceptDraw Solution Park.
Use it to create your education infogram in the ConceptDraw PRO diagramming and vector drawing software.
The vector stencils library "Education charts" is included in the Education Infographics solution from the Business Infographics area of ConceptDraw Solution Park.
Area chart - serial

Column chart

Column chart - serial

Divided bar diagram

Frequency histogram

Horizontal bar chart

Horizontal bar chart - serial

Line chart - serial

Pie chart

Ring chart

Scatter plot

Scatter plot - serial

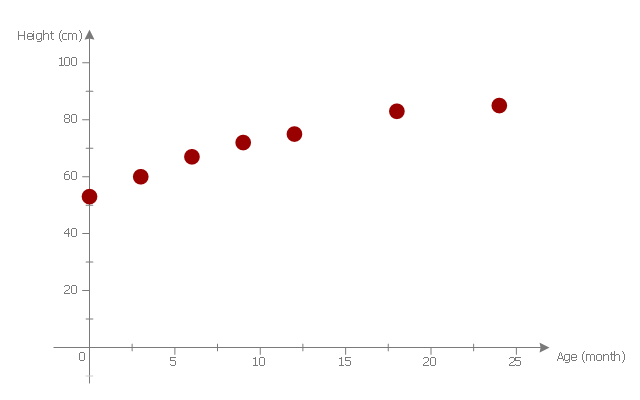
This scatter graph example visualize correlation between baby height and age.
"Human height is the distance from the bottom of the feet to the top of the head in a human body, standing erect. It is usually measured in centimetres when using the metric system, and feet and inches when using the imperial system. Human height has varied from under 60 centimetres (2 ft 0 in) to over 260 centimetres (8 ft 6 in). On average, males are taller than females. ...
Growth in stature, determined by its various factors, results from the lengthening of bones via cellular divisions chiefly regulated by somatotropin (human growth hormone (hGH)) secreted by the anterior pituitary gland. ...
The majority of linear growth occurs as growth of cartilage at the epiphysis (ends) of the long bones which gradually ossify to form hard bone. The legs compose approximately half of adult human height, and leg length is a somewhat sexually dimorphic trait. Some of this growth occurs after the growth spurt of the long bones has ceased or slowed. The majority of growth during growth spurts is of the long bones. Additionally, the variation in height between populations and across time is largely due to changes in leg length. The remainder of height consists of the cranium. Height is sexually dimorphic and statistically it is more or less normally distributed, but with heavy tails." [Human height. Wikipedia]
The scatter plot example "Baby height by age" was created using the ConceptDraw PRO diagramming and vector drawing software extended with the Scatter Diagrams solution from the Graphs and Charts area of ConceptDraw Solution Park.
Scatter diagram
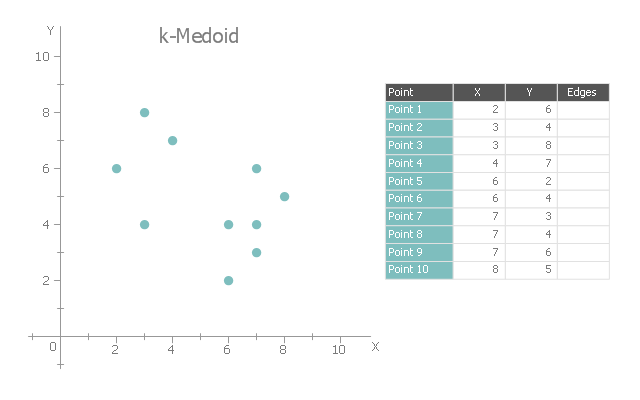
This scatter graph sample illustrates k-medoids algorithm.
"The k-medoids algorithm is a clustering algorithm related to the k-means algorithm and the medoidshift algorithm. Both the k-means and k-medoids algorithms are partitional (breaking the dataset up into groups) and both attempt to minimize the distance between points labeled to be in a cluster and a point designated as the center of that cluster." [K-medoids. Wikipedia]
The scatterplot example "k-Medoid" was created using the ConceptDraw PRO diagramming and vector drawing software extended with the Scatter Diagrams solution from the Graphs and Charts area of ConceptDraw Solution Park.
Scatterplot
- Scatter Plot | Scatter Chart Examples | Blank Scatter Plot | Scatter Plot
- Scatter Plot | Blank Scatter Plot | Design elements - Scatterplot ...
- Scatter Diagrams | Blank Scatter Plot | Scatter Chart Examples ...
- Baby Age And Height Scatter Plot
- Scatter Diagrams | Blank Scatter Plot | How to Draw a Scatter ...
- Scatter Graph Charting Software | Scatter Plot | Scatter Chart ...
- Design elements - Scatterplot | Scatter Plot | Scatter Graph Charting ...
- Scatter Chart Examples | Scatter Plot | Scatter Graph | Scatter Plot ...
- Scatter Chart Examples | Design elements - Scatterplot | Design ...
- Swot Analysis Scatterplot
- Design elements - Scatterplot | Scatter Plot | Scatter Chart Examples ...
- Scatter Chart Examples | Scatter Plot | Make a Scatter Plot | Example ...
- Scatter Chart Examples | Scatter Plot Graph | Line Chart Examples ...
- Four Dimensions Bubble Plot | Scatter Plot | Blank Scatter Plot | Plot ...
- Scatterplot Diagram On Tqm With Example
- Circle Spoke Diagram Template | Fishbone Diagram Template ...
- Scatter Chart Examples | Scatter Diagrams | How to Draw a Scatter ...
- Scatter Diagrams | Scatter Chart Examples | Scatter Chart Analysis ...
- Scatter Diagrams | Scatter Graph Charting Software | Scatter Graph ...
- How to Draw a Scatter Diagram Using ConceptDraw PRO | Scatter ...
- ERD | Entity Relationship Diagrams, ERD Software for Mac and Win
- Flowchart | Basic Flowchart Symbols and Meaning
- Flowchart | Flowchart Design - Symbols, Shapes, Stencils and Icons
- Flowchart | Flow Chart Symbols
- Electrical | Electrical Drawing - Wiring and Circuits Schematics
- Flowchart | Common Flowchart Symbols
- Flowchart | Common Flowchart Symbols