This site uses cookies. By continuing to browse the ConceptDraw site you are agreeing to our Use of Site Cookies.

Scatter Chart Examples

The Line Graphs solution from Graphs and Charts area of ConceptDraw Solution Park contains a set of examples, templates and design elements library of scatter charts.
Use it to draw scatter graphs using ConceptDraw DIAGRAM diagramming and vector drawing software for illustrating your documents, presentations and websites.

Scatter Graph Charting Software

ConceptDraw provides some interactive xy chart and scatter graph symbols that offers advanced features yet is simple to use.

Scatter Graph

You've got to draw the Scatter Graph and look for the convenient tool which will help you? Direct your attention on the ConceptDraw DIAGRAM diagramming and vector drawing software extended with Scatter Diagrams Solution from the Graphs and Charts Area.

Scatter Chart Analysis. Scatter Chart Example

This sample shows the Scatter Chart that displays the polls on the referendum 2014 in Scotland. On this Scatter Chart the data are represented as points with two values of variables in the Cartesian coordinates. The points are connected by lines. This diagram can be useful in different opinion polls, referendums, for creating the reports.

Scatter Diagram

This sample shows the scatter diagram that displays the inverse correlation. The correlation measures the strength of association among two variables. You can see that when the number of widgets increases, the price per 100 widgets decreases.
Using the ready-to-use objects from the Line Graphs Solution for ConceptDraw DIAGRAM you can create your own professional looking Scatter Charts quick and easy.

Scatter Plot

A scatter plot is also known to be called as a scatter graph, scatterplot, scatter chart, scatter diagram or scattergram. It is a type of a plot or mathematical diagram and to make it the Cartesian coordinates can be used for displaying the numeral values for usually two variables for one set of data.

scatter chart, scatter graph, scatter plot Scatter Diagrams

scatter chart, scatter graph, scatter plot
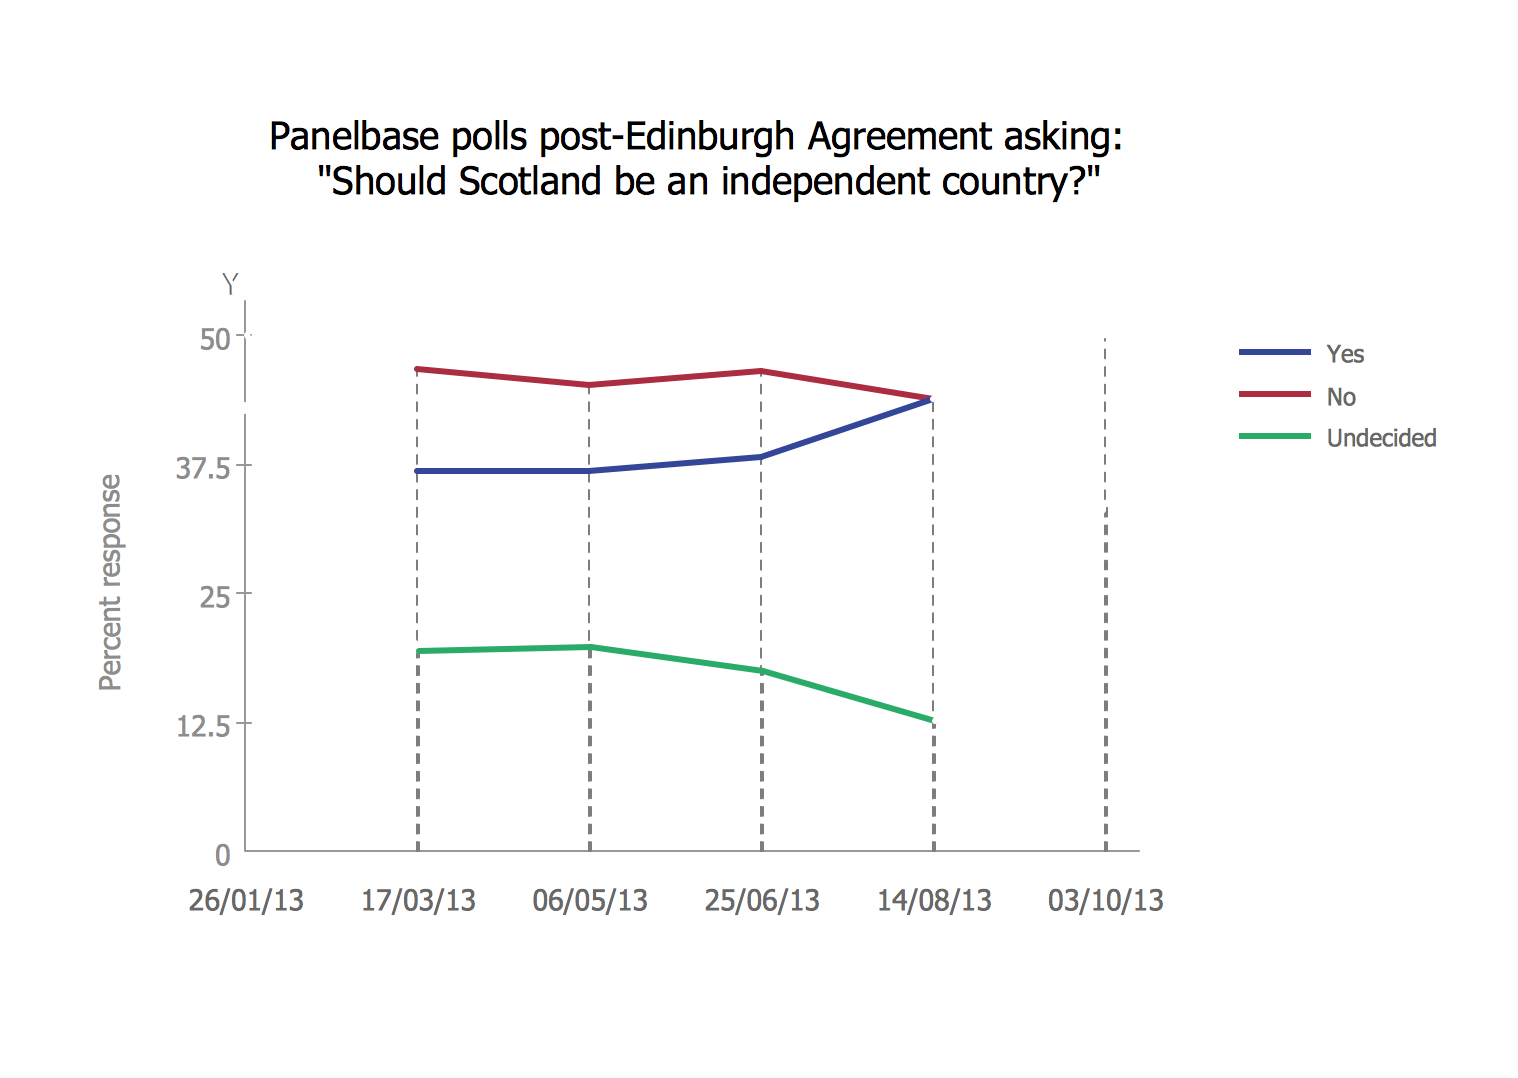
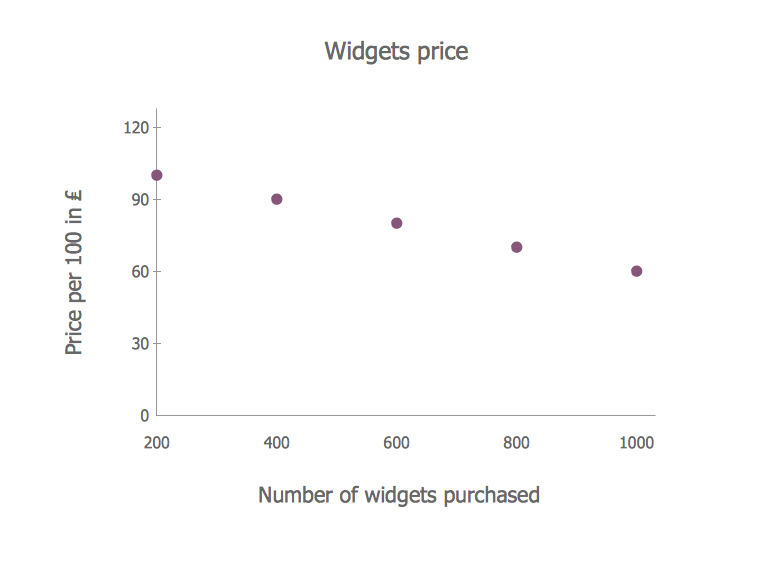
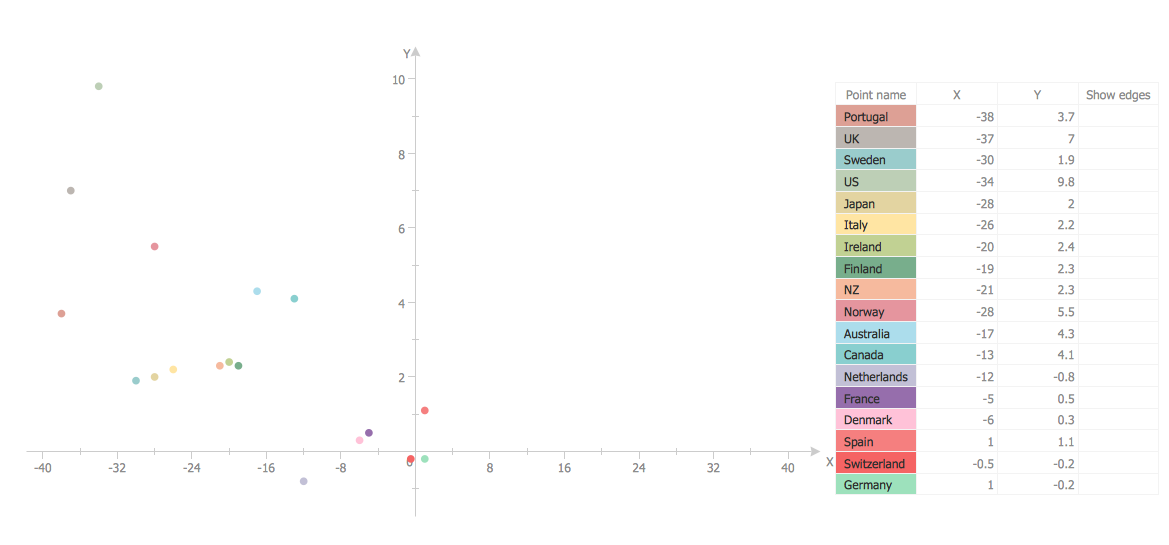
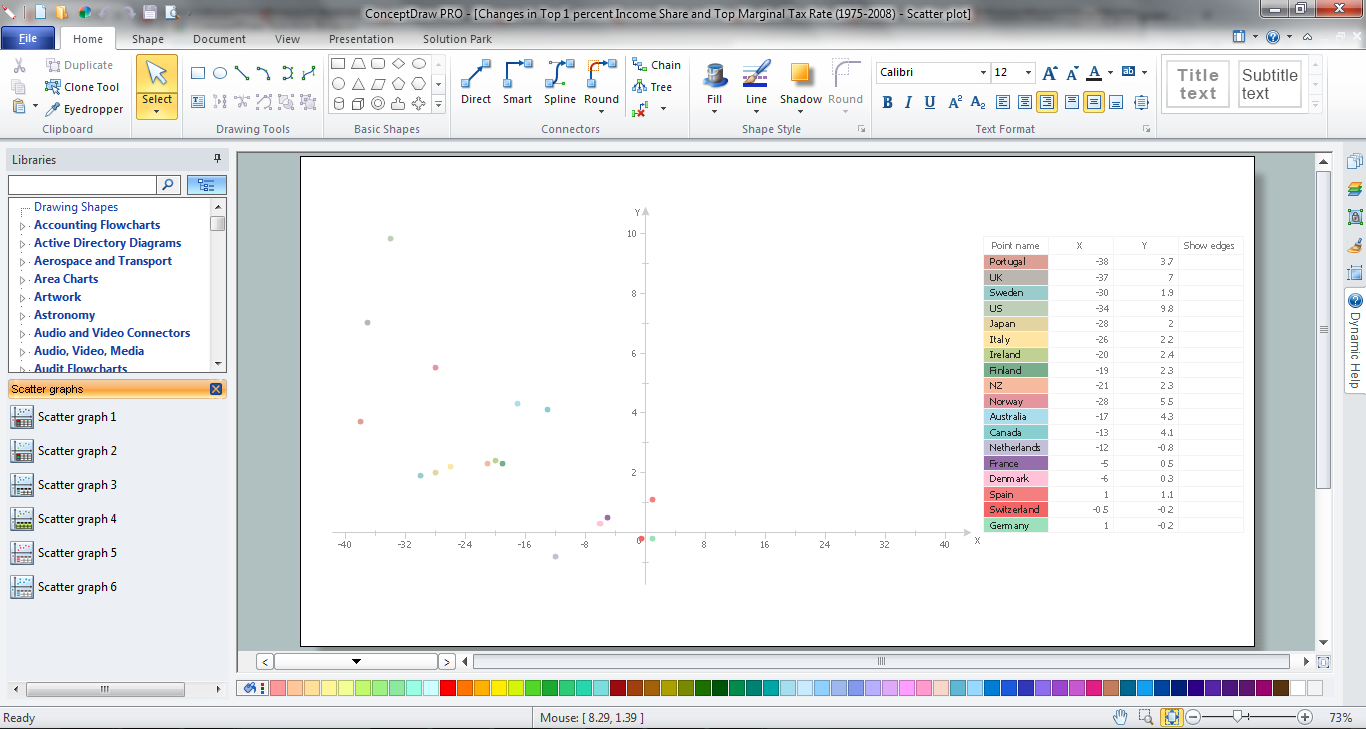
The Scatter Diagrams solution extends ConceptDraw DIAGRAM functionality with templates, samples, and a library of vector stencils that make construction of a Scatter Plot easy. The Scatter Chart Solution makes it easy to design attractive Scatter Diagrams used in various fields of science, work, and life activities. ConceptDraw DIAGRAM lets you enter the data to the table and construct the Scatter Plot Graph automatically according to these data.

Scatter Plot Graph

ConceptDraw DIAGRAM extended with Scatter Diagrams solution is the best diagramming and vector drawing software for quick and easy designing the Scatter Plot Graph of any complexity.

Make a Scatter Plot

ConceptDraw DIAGRAM diagramming and vector drawing software offers the Scatter Diagrams Solution from the Graphs and Charts Area to make a Scatter Plot creating fast and simple.

Blank Scatter Plot

This sample shows the Scatter Plot without missing categories. It’s very important to no miss the data, because this can have the grave negative consequences. The data on the Scatter Chart are represented as points with two values of variables in the Cartesian coordinates. This sample can be used in the engineering, business, statistics, analytics, at the creating the financial and other types of reports.