Electrical Symbols, Electrical Diagram Symbols

This solution provides 26 libraries which contain 926 electrical symbols from electrical engineering: Analog and Digital Logic, Composite Assemblies, Delay Elements, Electrical Circuits, Electron Tubes, IGFET, Inductors, Integrated Circuit, Lamps, Acoustics, Readouts, Logic Gate Diagram, MOSFET, Maintenance, Power Sources, Qualifying, Resistors, Rotating Equipment, Semiconductor Diodes, Semiconductors, Stations, Switches and Relays, Terminals and Connectors, Thermo, Transformers and Windings, Transistors, Transmission Paths,VHF UHF SHF.
Piping and Instrumentation Diagram Software

Plumbing and Piping Plans solution helps you create quick and easy: key piping and instrument details ,piping diagrams, instrumentation diagrams, schemes of hot and cold water supply systems, control and shutdown schemes, diagrams of plumbing systems, heating schemes, schematics of waste water disposal systems, safety and regulatory requirements, diagrams of ventilation systems, mechanical diagrams, industrial diagrams, basic start up and operational information.
Program Evaluation and Review Technique (PERT) with ConceptDraw DIAGRAM

CAD Drawing Software for Making Mechanic Diagram and Electrical Diagram Architectural Designs


Network Diagram Software. LAN Network Diagrams. Physical Office Network Diagrams


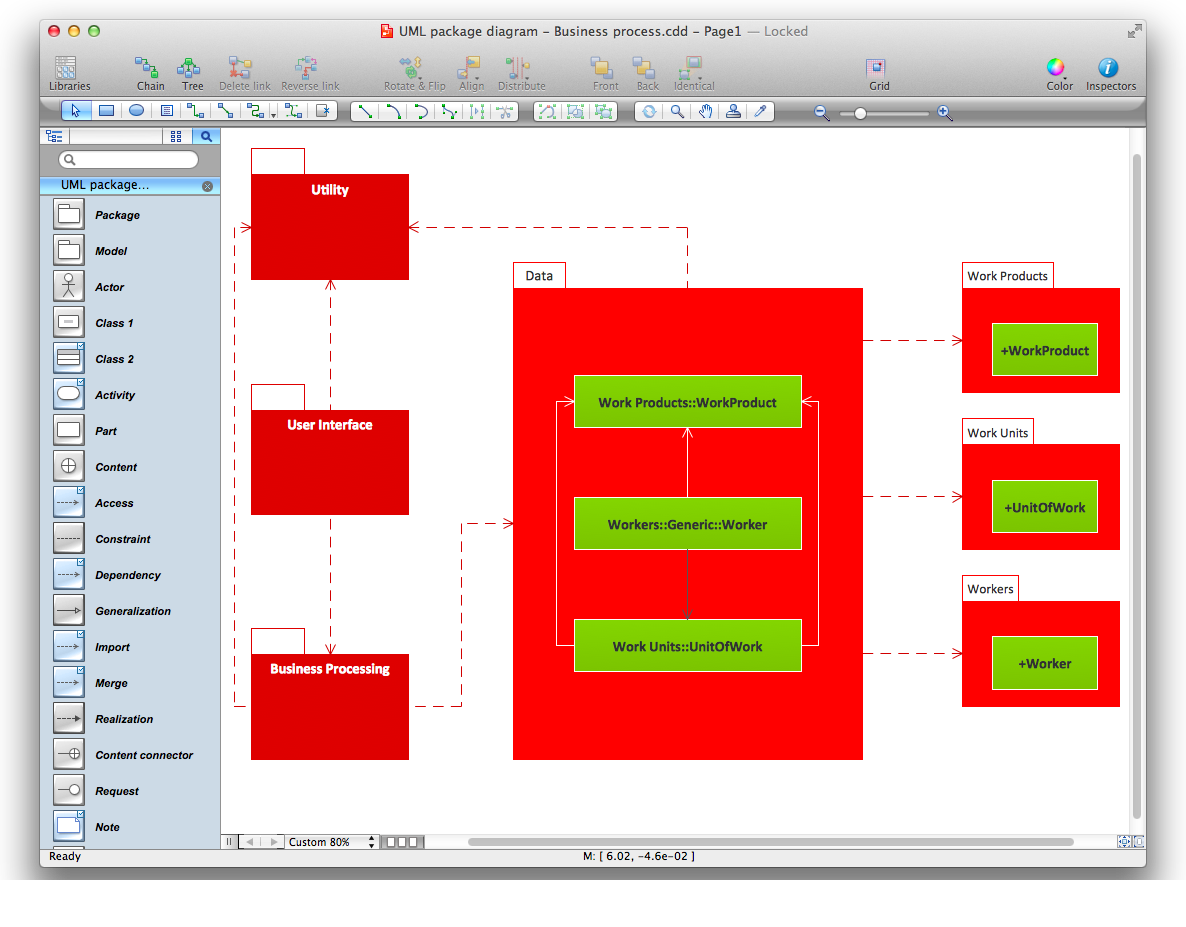
Diagramming Software for Design UML Package Diagrams

Active Directory Diagram

With the help of ConceptDraw DIAGRAM extended with Active Directory Diagrams Solution from the Computer and Networks Area you can easily and quickly create the highly detailed Active Directory Diagram.
Software Diagram Examples and Templates

Software Development area of ConceptDraw Solution Park provides 5 solutions:
Data Flow Diagrams, Entity-Relationship Diagram (ERD), Graphic User Interface, IDEFO Diagrams, Rapid UML.
Sales Process Flowchart. Flowchart Examples

Business Report Pie. Pie Chart Examples

- PI Diagram Symbols
- Process Flowchart | Types of Flowcharts | Pie Chart Examples and ...
- Symbols Pi
- Process Flow Diagram Symbols
- Atmosphere air composition | Percentage Pie Chart . Pie Chart ...
- Physics Diagrams | Physics Symbols | How to Draw Physics ...
- Well Label Diagram Of Crude Distillation Unit
- Maths Pie Chart Design Image
- Swim Lane Diagrams | Swim Lane Flowchart Symbols | Cross ...
- Pi Diagram Maker
- ERD | Entity Relationship Diagrams, ERD Software for Mac and Win
- Flowchart | Basic Flowchart Symbols and Meaning
- Flowchart | Flowchart Design - Symbols, Shapes, Stencils and Icons
- Flowchart | Flow Chart Symbols
- Electrical | Electrical Drawing - Wiring and Circuits Schematics
- Flowchart | Common Flowchart Symbols
- Flowchart | Common Flowchart Symbols