Pyramid Diagram

"The Time/ Money/ Quality Triangle illustrates an advertising truism, that "you can't have all three." If there is little time or money, then ad quality will suffer. The more time and/ or money that is available to the project, the higher the quality can be. However, the level of quality must be appropriate to the product...not all products should have high-quality ads!" [Advertising/ Strategies. Wikibooks]
This triangular diagram example was redesigned using the ConceptDraw PRO diagramming and vector drawing software from Wikimedia Commons file Time-Quality-Money.png. [commons.wikimedia.org/ wiki/ File:Time-Quality-Money.png]
This file is licensed under the Creative Commons Attribution-Share Alike 3.0 Unported license. [creativecommons.org/ licenses/ by-sa/ 3.0/ deed.en]
The chart sample "Time, quality, money triangle diagram" is included in the Pyramid Diagrams solution from the Marketing area of ConceptDraw Solution Park.
Triangular chart

Money - Design Elements

Various styles of money design elements (currency symbols, clipart, money symbols) can be found in ConceptDraw PRO Business and Finance Solution.
Pyramid Diagram

Pyramid Diagram

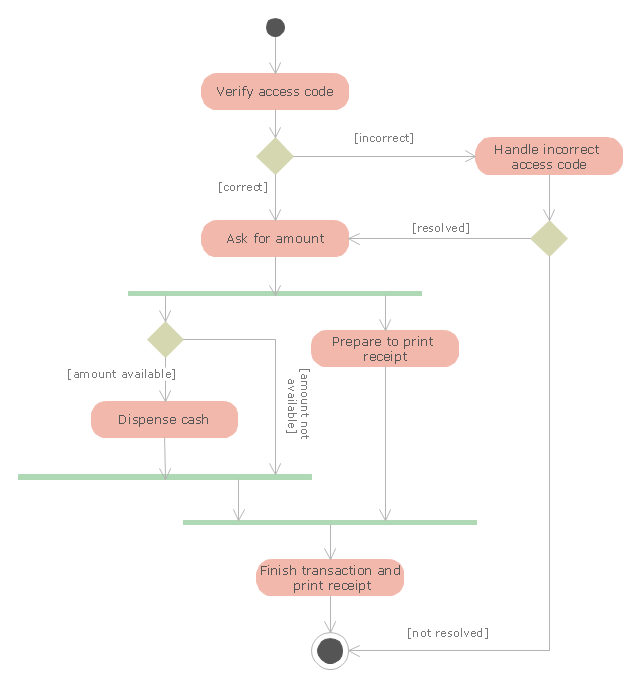
"An automated teller machine or automatic teller machine" (ATM) (American, Australian, Singaporean, Indian, and Hiberno-English), also known as an automated banking machine (ABM) (Canadian English), cash machine, cashpoint, cashline or hole in the wall (British, South African, and Sri Lankan English), is an electronic telecommunications device that enables the clients of a financial institution to perform financial transactions without the need for a cashier, human clerk or bank teller.
On most modern ATMs, the customer is identified by inserting a plastic ATM card with a magnetic stripe or a plastic smart card with a chip that contains a unique card number and some security information such as an expiration date or CVVC (CVV). Authentication is provided by the customer entering a personal identification number (PIN). The newest ATM at Royal Bank of Scotland allows customers to withdraw cash up to £100 without a card by inputting a six-digit code requested through their smartphones.
Using an ATM, customers can access their bank accounts in order to make cash withdrawals, get debit card cash advances, and check their account balances as well as purchase pre-paid mobile phone credit. If the currency being withdrawn from the ATM is different from that which the bank account is denominated in (e.g.: Withdrawing Japanese yen from a bank account containing US dollars), the money will be converted at an official wholesale exchange rate. Thus, ATMs often provide one of the best possible official exchange rates for foreign travellers, and are also widely used for this purpose." [Automated teller machine. Wikipedia]
The UML activity diagram example "Cash withdrawal from ATM" was created using the ConceptDraw PRO diagramming and vector drawing software extended with the Rapid UML solution from the Software Development area of ConceptDraw Solution Park.
UML activity diagram
Fundraising Pyramid

"Causes in the diagram are often categorized, such as to the 6 M's ...
The 6 Ms (used in manufacturing industry):
(1) Machine (technology);
(2) Method (process);
(3) Material (Includes Raw Material, Consumables and Information.);
(4) Man Power (physical work)/ Mind Power (brain work): Kaizens, Suggestions;
(5) Measurement (Inspection);
(6) Milieu/ Mother Nature (Environment).
The original 6Ms used by the Toyota Production System have been expanded by some to include the following and are referred to as the 8Ms. However, this is not globally recognized. It has been suggested to return to the roots of the tools and to keep the teaching simple while recognizing the original intent; most programs do not address the 8Ms.
(7) Management/ Money Power;
(8) Maintenance." [Ishikawa diagram. Wikipedia]
This 8Ms Ishikawa diagram (manufacturing cause and effect diagram) template is included in the Fishbone Diagram solution from the Management area of ConceptDraw Solution Park.
8Ms Ishikawa diagram

This hexagon diagram sample was redesigned from the Wikipedia file: Vicious circle in macroeconomics.svg. "An example of the use of a vicious circle in macroeconomics." [en.wikipedia.org/ wiki/ File:Vicious_ circle_ in_ macroeconomics.svg]
"A virtuous circle and a vicious circle (also referred to as virtuous cycle and vicious cycle) are economic terms. They refer to a complex chain of events that reinforces itself through a feedback loop. A virtuous circle has favorable results, while a vicious circle has detrimental results.
Both circles are complexes of events with no tendency towards equilibrium (at least in the short run). Both systems of events have feedback loops in which each iteration of the cycle reinforces the previous one (positive feedback). These cycles will continue in the direction of their momentum until an external factor intervenes and breaks the cycle. The prefix "hyper-" is sometimes used to describe these cycles if they are extreme. The best-known example of a vicious circle is hyperinflation. ...
Example in macroeconomics.
Vicious circle.
Hyperinflation is a spiral of inflation which causes even higher inflation. The initial exogenous event might be a sudden large increase in international interest rates or a massive increase in government debt due to excessive spendings. Whatever the cause, the government could pay down some of its debt by printing more money (called monetizing the debt). This increase in the money supply could increase the level of inflation. In an inflationary environment, people tend to spend their money quickly because they expect its value to decrease further in the future. They convert their financial assets into physical assets while their money still has some purchasing power. Often they will purchase on credit. Eventually, the currency loses all of its value. Because of this, the level of savings in the country is very low and the government could have problems refinancing its debt. Its solution could be to print still more money starting another iteration of the vicious cycle." [Virtuous circle and vicious circle. Wikipedia]
The crystal diagram example "Vicious circle" was created using the ConceptDraw PRO diagramming and vector drawing software extended with the Target and Circular Diagrams solution from the Marketing area of ConceptDraw Solution Park.
www.conceptdraw.com/ solution-park/ marketing-target-and-circular-diagrams
Hexagon diagram

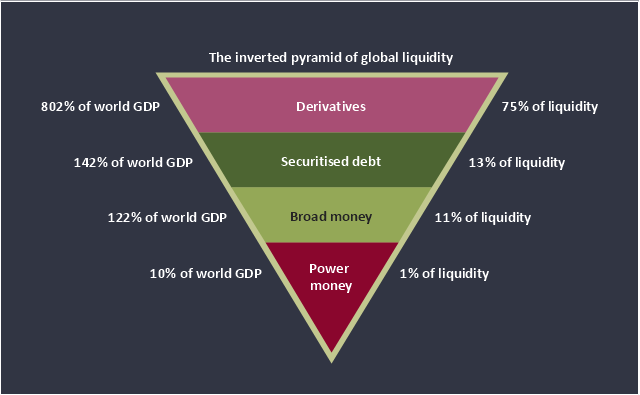
This inverted pyramid diagram of global liquidity shows world GDP and liquidity for 4 levels: derivatives, securitised debt, broad money, and power money.
"In business, economics or investment, market liquidity is a market's ability to facilitate an asset being sold quickly without having to reduce its price very much (or even at all). Equivalently, an asset's market liquidity (or simply "an asset's liquidity") is the asset's ability to sell quickly without having to reduce its price very much. Liquidity is about how big the trade-off is between the speed of the sale and the price it can be sold for. In a liquid market, the trade-off is mild: selling quickly will not reduce the price much. In a relatively illiquid market, selling it quickly will require cutting its price by some amount.
Money, or cash, is the most liquid asset, because it can be "sold" for goods and services instantly with no loss of value. There is no wait for a suitable buyer of the cash. There is no trade-off between speed and value. It can be used immediately to perform economic actions like buying, selling, or paying debt, meeting immediate wants and needs.
If an asset is moderately (or very) liquid, it has moderate (or high) liquidity. In an alternative definition, liquidity can mean the amount of highly liquid assets. If a business has moderate liquidity, it has a moderate amount of very liquid assets. If a business has sufficient liquidity, it has a sufficient amount of very liquid assets and the ability to meet its payment obligations." [Market liquidity. Wikipedia]
This inverted triangle diagram was redesigned using the ConceptDraw PRO diagramming and vector drawing software from Wikimedia Commons file The inverted pyramid of global liquidity.gif. [commons.wikimedia.org/ wiki/ File:The_ inverted_ pyramid_ of_ global_ liquidity.gif]
This triangular chart example is included in the Pyramid Diagrams solution from the Marketing area of ConceptDraw Solution Park.
Inverted pyramid diagram
Pyramid Diagram

Flow chart Example. Warehouse Flowchart

Standard warehousing process flow diagram and standard workflow diagram used for process identification for further evaluating effectiveness and profitability of overall business process. Use the ConceptDraw PRO diagramming and vector drawing software extended with the Flowcharts solution from the Diagrams area of ConceptDraw Solution Park to design your own workflow diagrams, process flow diagram and flow charts. Need to use Process Flow Diagram for designing Warehouse packages flow.

Pyramid Diagram

Energy Pyramid Diagram

Energy Pyramid Diagram begins from the producers (plants) and proceeds through a few trophic levels of consumers (herbivores which eat these plants, the carnivores which eat these herbivores, then carnivores which eat those carnivores, and so on) to the top of the food chain.
Pyramid Diagram

- Pyramid Diagram | Time, quality, money triangle diagram | Pyramid ...
- A Mobile Money Context Diagram
- Activity Diagram For Drawing Money From Bank Through Cheque
- Time, quality, money triangle diagram | Pyramid Diagram ...
- Plastic Money Description With Diagram
- Pyramid Diagram | Time, quality, money triangle diagram ...
- Component Diagram Online Money Transfer
- Money Transfer Class Diagram
- Entity-Relationship Diagram (ERD) | Money In Transit Vector Png
- Audit Flowcharts | Pyramid Diagrams | Entity-Relationship Diagram ...
- Money - Design Elements | Diagram Of A Cash Sorting Machine
- Entity-Relationship Diagram (ERD) | Mobile Money Data Flo ...
- Manufacturing 8 Ms fishbone diagram - Template | Fishbone ...
- Money - Design Elements | Interior Design Office Layout Plan ...
- UML activity diagram - Cash withdrawal from ATM | UML Activity ...
- Money - Design Elements | Counting Machine Diagram
- Mobile Money Usecase Diagram
- UML use case diagram - Banking system | UML activity diagram ...
- ATM UML Diagrams | Activity Diagram Withdraw Money From Bank ...
- Indian Plastic Money Diagrams
- ERD | Entity Relationship Diagrams, ERD Software for Mac and Win
- Flowchart | Basic Flowchart Symbols and Meaning
- Flowchart | Flowchart Design - Symbols, Shapes, Stencils and Icons
- Flowchart | Flow Chart Symbols
- Electrical | Electrical Drawing - Wiring and Circuits Schematics
- Flowchart | Common Flowchart Symbols
- Flowchart | Common Flowchart Symbols