Flowchart design. Flowchart symbols, shapes, stencils and icons

Mavericks have always desired to stand apart and gorgeous design is the recipe for that. Any business graphic document will be more understandable if will use an expository color scheme for their parts. Flowchart design makes versatile presenting and explaining of the process and gives a fresh view that distinguishes it from black and white flowcharts on a paper. Workflow diagram or process flow diagrams become more understandable to ordinary people when it use minimum symbols and special signs.
The best design can be accomplished by starting from any of the suitable Conceptdraw examples. Pick one of them and begin to input proper text into each Flowchart symbols and shapes. Apply less colors in the document and don't turn into rainbow your diagram, three or four will be enough, also note that business process flowchart may not contain bright color hues. The next clue is to use identical colors for same flowchart shape types.

HelpDesk
How to Change the Font for an Entire Level of a Mind Map

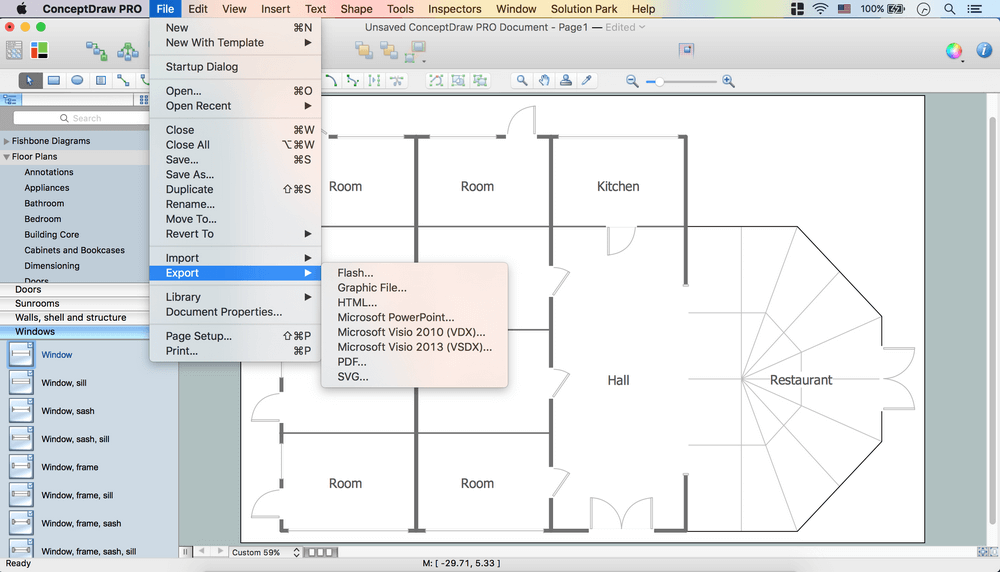
Create Floor Plans Easily with ConceptDraw DIAGRAM
Primarily, this basic knowledge of the composition rules. It helps to compose, to place the shapes and volume of the interior, to achieve balance in the room between the free space and objects. This might help to compose correctly, to place the shapes and the volumes in the interior, to achieve balance between free space and furniture in the room.
Basic color theory. There are strictly defined rules and laws, which are used to select a fitting color combinations to create a harmonious interior.

Value Stream Mapping Symbols

Audit Flowchart Symbols

Audit Flowchart Symbols - It’s efficiently to use the colors creating the audit flowcharts to make them bright, visual, attractive and successful. The best flowchart maker use ConceptDraw DIAGRAM features of RapidDraw technique.
Graphical User Interface Examples

Business Process Mapping — How to Map a Work Process

Video tutorials on ConceptDraw products. Try it today!
Entity Relationship Diagram Examples

ConceptDraw DIAGRAM diagramming and vector drawing software gives the ability to describe a database using the Entity-Relationship model. Entity-Relationship Diagram(ERD) solution from the Software Development area supplies the ConceptDraw DIAGRAM with icons advocated by Chen's and Crow’s Foot notation that can be used when describing a database.

Electrical Symbols — Logic Gate Diagram

26 libraries of the Electrical Engineering Solution of ConceptDraw DIAGRAM make your electrical diagramming simple, efficient, and effective. You can simply and quickly drop the ready-to-use objects from libraries into your document to create the electrical diagram.
Local area network (LAN). Computer and Network Examples
 diagram")
ConceptDraw - Perfect Network Diagramming Software with examples of LAN Diagrams. ConceptDraw Network Diagram is ideal for network engineers and network designers who need to draw Local Area Network diagrams.

- Mind Map Line
- Color Palette Mapping Function Flowchart
- Basic Flowchart Symbols and Meaning | Audit Flowchart Symbols ...
- Infield Positioning for Baseball Situations | Positioning map ...
- Basic Flowchart Symbols and Meaning | Cross Functional Flowchart ...
- How to Customize the Style of Your Mind Map | How to Change the ...
- Colour Chart Infographic
- Basketball Court Plan Colour
- Atmosphere air composition | Percentage Pie Chart. Pie Chart ...
- Transport map - Template | Transit map template | Bus Transport ...
- ERD | Entity Relationship Diagrams, ERD Software for Mac and Win
- Flowchart | Basic Flowchart Symbols and Meaning
- Flowchart | Flowchart Design - Symbols, Shapes, Stencils and Icons
- Flowchart | Flow Chart Symbols
- Electrical | Electrical Drawing - Wiring and Circuits Schematics
- Flowchart | Common Flowchart Symbols
- Flowchart | Common Flowchart Symbols