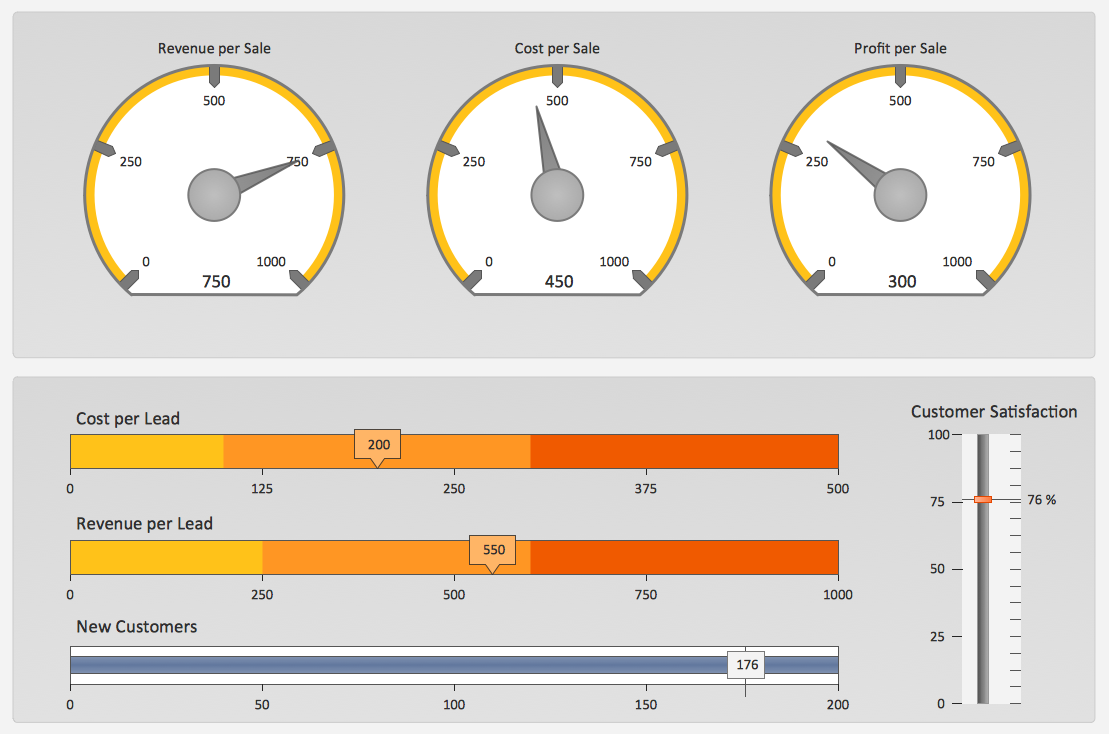
KPIs and Metrics

Data Visualization Solutions

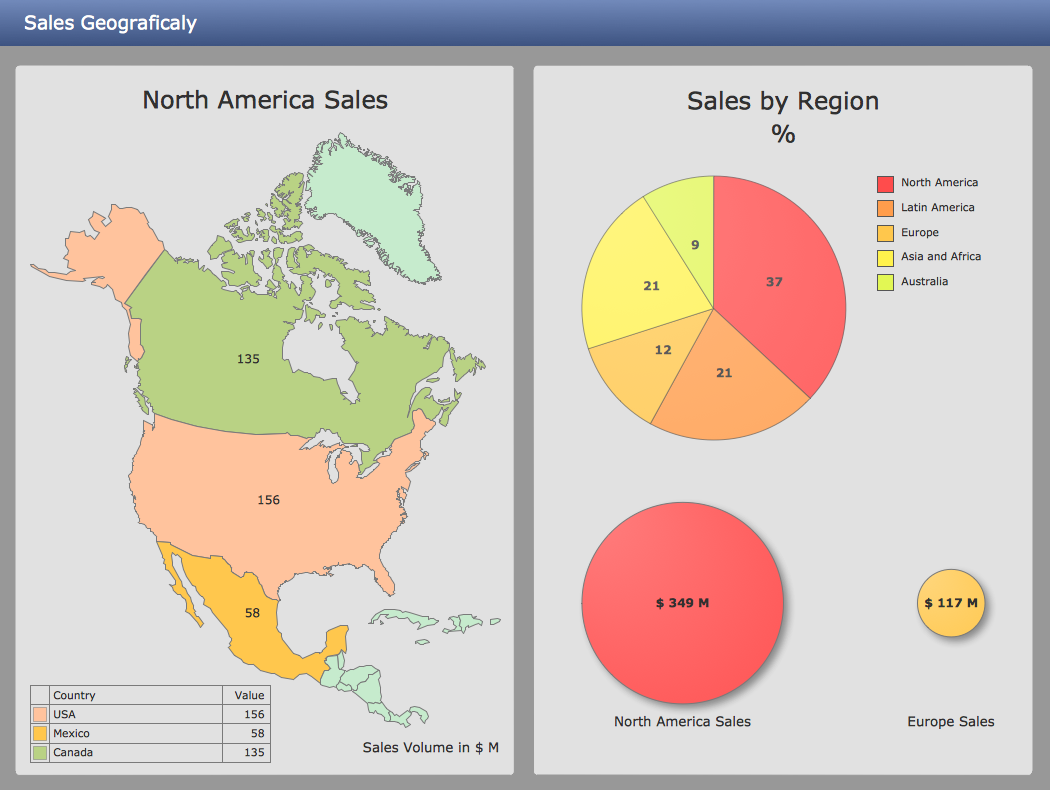
Visualize Sales Data Using Sample Data

Ways You Can Visualize Sales Data
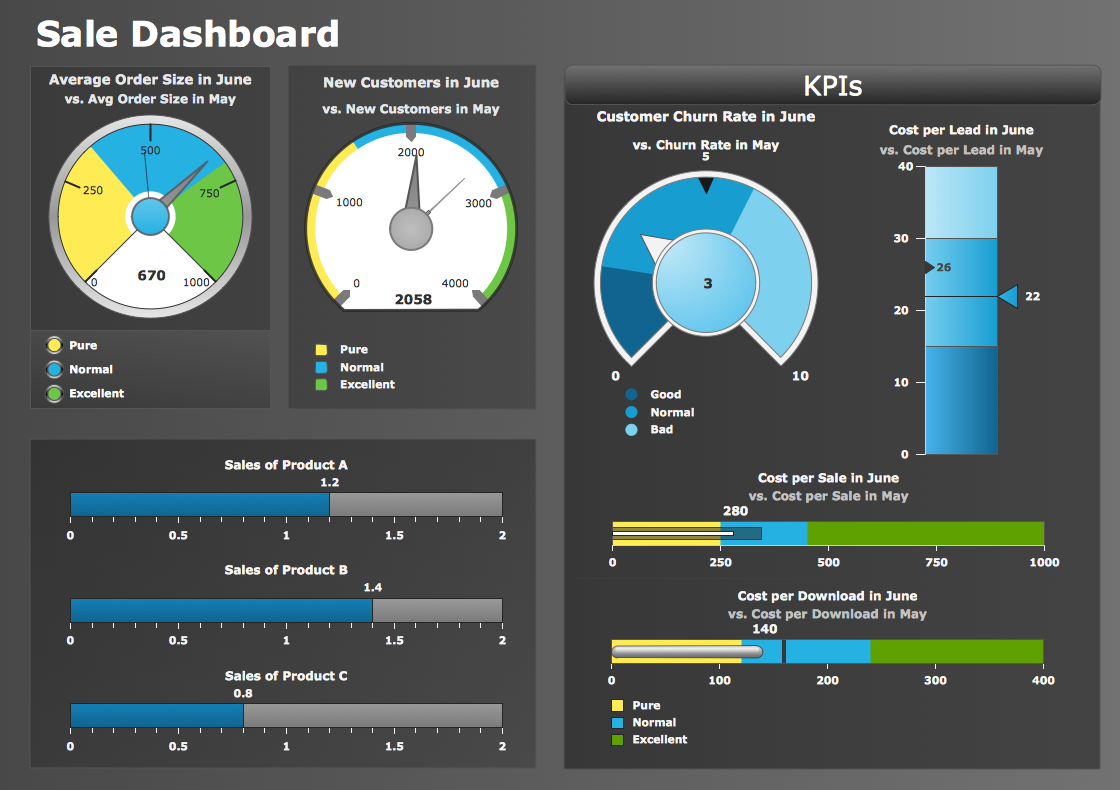
Sales Dashboard Solutions can help your sales team keep an eye on performance
Sales Dashboards for Your Company

Sales Performance
Data Visualization Software Solutions

Reporting & Data Visualization

Performance Indicators

- Visualization Of Kpi Ppt
- KPIs and Metrics | Visualize Sales Data Using Sample Data | Data ...
- Sales Plan | Data Visualization Solutions | How to Deliver ...
- KPI Dashboard | What is a KPI ? | Performance Indicators | Key ...
- Sales Performance | Sales Process Map | Sales Growth. Bar Graphs ...
- Performance Indicators | Constant improvement of key performance ...
- Sales Dashboards for Your Company | Business Intelligence ...
- Performance Indicators | KPI Dashboard | Constant improvement of ...
- Sales Dashboard Solutions can help your sales team keep an eye ...
- Logistics Performance Dashboard - Template | Sales KPIs ...
- ERD | Entity Relationship Diagrams, ERD Software for Mac and Win
- Flowchart | Basic Flowchart Symbols and Meaning
- Flowchart | Flowchart Design - Symbols, Shapes, Stencils and Icons
- Flowchart | Flow Chart Symbols
- Electrical | Electrical Drawing - Wiring and Circuits Schematics
- Flowchart | Common Flowchart Symbols
- Flowchart | Common Flowchart Symbols