Line Chart Template for Word

This sample shows the Line Chart of annual percentage change. The Line Chart allows you to clearly see the changes of data over the time.
Bar Chart Template for Word

You can quickly rework these bar graph templates into your own charts by simply changing displayed data, title and legend texts.
Chart Templates

Sales Growth. Bar Graphs Example

Basic Diagramming


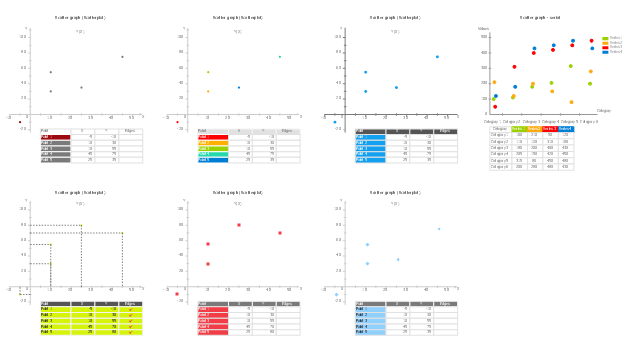
This vector stencils library contains 6 templates of scatter graphs.
The scatter graph (scattergraph. scatter chart, scatter plot, scatterplot, scatter diagram) is used for visual analysis of correlation or dependence between two variables.
"In statistics, dependence is any statistical relationship between two random variables or two sets of data. Correlation refers to any of a broad class of statistical relationships involving dependence.
Familiar examples of dependent phenomena include the correlation between the physical statures of parents and their offspring, and the correlation between the demand for a product and its price. Correlations are useful because they can indicate a predictive relationship that can be exploited in practice. For example, an electrical utility may produce less power on a mild day based on the correlation between electricity demand and weather. In this example there is a causal relationship, because extreme weather causes people to use more electricity for heating or cooling; however, statistical dependence is not sufficient to demonstrate the presence of such a causal relationship (i.e., correlation does not imply causation).
Formally, dependence refers to any situation in which random variables do not satisfy a mathematical condition of probabilistic independence. In loose usage, correlation can refer to any departure of two or more random variables from independence, but technically it refers to any of several more specialized types of relationship between mean values." [Correlation and dependence. Wikipedia]
The scatter chart templates example "Design elements - Scatter graphs" was created using the ConceptDraw PRO diagramming and vector drawing software extended with the Scatter Diagrams solution from the Graphs and Charts area of ConceptDraw Solution Park.
Scattergraph templates
Pie Chart Word Template. Pie Chart Examples

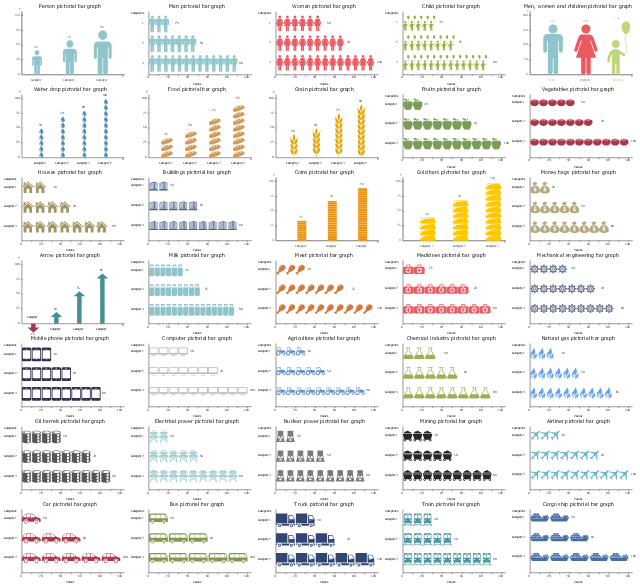
"Pictorial bar graph.
Sometimes reffered to as a pictographs. A pictorial bar graph is a graph in which the rectangular bars have been filled with pictures, sketches, icons, etc. or where pictures, sketches, icons, etc. have been substituted for the rectangular bars. In both variations, one or more symbols might be used in each bar. The two major reasons for using pictorial graphs are to make the graph more appealing visually and to facilitate better communications." [Information Graphics: A Comprehensive Illustrated Reference. R. L. Harris. 1999. p.41]
The example"Design elements - Picture graphs" was created using the ConceptDraw PRO diagramming and vector drawing software extended with the Picture Graphs solution from the Graphs and Charts area of ConceptDraw Solution Park.
Pictorial chart templates
Create Graphs and Charts

Chart Maker for Presentations

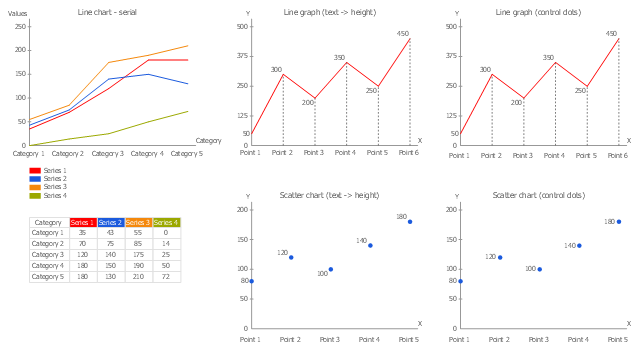
"A line chart or line graph is a type of chart which displays information as a series of data points connected by straight line segments. It is a basic type of chart common in many fields. It is similar to a scatter plot except that the measurement points are ordered (typically by their x-axis value) and joined with straight line segments. A line chart is often used to visualize a trend in data over intervals of time – a time series – thus the line is often drawn chronologically." [Line chart. Wikipedia]
The templates example "Design elements - Line graphs" was drawn using the ConceptDraw PRO diagramming and vector drawing software extended with the Line Graphs solution from the Graphs and Charts area of ConceptDraw Solution Park.
The templates example "Design elements - Line graphs" was drawn using the ConceptDraw PRO diagramming and vector drawing software extended with the Line Graphs solution from the Graphs and Charts area of ConceptDraw Solution Park.
Line chart templates
Line Graph Charting Software

Line Chart Examples

Pictures of Graphs

Bar Chart Examples

- Line Chart Template for Word | Line Graph Charting Software | Chart ...
- Picture graph - Template | Design elements - Picture graphs | Picture ...
- Line Chart Template for Word | Line graph template - The number of ...
- Area Graph Template
- Graphs Templates
- Line Graph Templates
- Sales Growth. Bar Graphs Example | Organizational Chart ...
- Line Chart Template for Word | Line Graph Charting Software | Line ...
- Comparison Graph Template
- Examples Of Line Graph Templates
- Free Graph Templates
- Bar Graph | Bar Graphs | Double bar graph - Template | _bar Graph_
- Picture Chart Templates
- Double bar graph - Template | Bar Graphs | Nitrate concentration in ...
- Chart Graph Templates
- Picture graph - Template | Picture Graphs | Picture Graph | Picture ...
- Bar Chart Template for Word | Sales Growth. Bar Graphs Example ...
- Pie Chart Software | Pie Charts | Pie Chart Examples and Templates ...
- Normal distribution graph - Template | Scatter graph - Template ...
- Donut Graphs
- ERD | Entity Relationship Diagrams, ERD Software for Mac and Win
- Flowchart | Basic Flowchart Symbols and Meaning
- Flowchart | Flowchart Design - Symbols, Shapes, Stencils and Icons
- Flowchart | Flow Chart Symbols
- Electrical | Electrical Drawing - Wiring and Circuits Schematics
- Flowchart | Common Flowchart Symbols
- Flowchart | Common Flowchart Symbols