This cause and effect diagram sample was redesigned from the Wikimedia Commons file: Ursache Wirkung Diagramm Beispiel.png. [commons.wikimedia.org/ wiki/ File:Ursache_ Wirkung_ Diagramm_ Beispiel.png]
This file is licensed under the Creative Commons Attribution-Share Alike 3.0 Unported license. [creativecommons.org/ licenses/ by-sa/ 3.0/ deed.en]
"Productivity is the ratio of output to inputs in production; it is an average measure of the efficiency of production. Efficiency of production means production’s capability to create incomes which is measured by the formula real output value minus real input value.
Productivity is a crucial factor in production performance of firms and nations. Increasing national productivity can raise living standards because more real income improves people's ability to purchase goods and services, enjoy leisure, improve housing and education and contribute to social and environmental programs. Productivity growth also helps businesses to be more profitable." [Productivity. Wikipedia]
The fishbone diagram example "Increase in productivity" was created using the ConceptDraw PRO diagramming and vector drawing software extended with the Fishbone Diagrams solution from the Management area of ConceptDraw Solution Park.
Ishikawa diagram

Drawing Workflow Diagrams
Affinity Diagram

Root Cause Tree Diagram

Project — Working With Tasks

These videos provide a series of lessons that will enhance the understanding of all our users, from people just starting out with the software, through to expert users.
Examples of Flowcharts, Org Charts and More


Flowchart Software

ConceptDraw DIAGRAM flowchart software will help to quickly create new flowcharts, workflow, NS Diagram, BPMN Diagram, Cross-functional flowcharts, data flow diagrams and highlight flowcharts.
Feature-rich flowchart maker, free thousand flowchart examples and templates and colored symbols that will allow you to create professional looking flowcharts simply.
ConceptDraw DIAGRAM supports macOS and Windows.

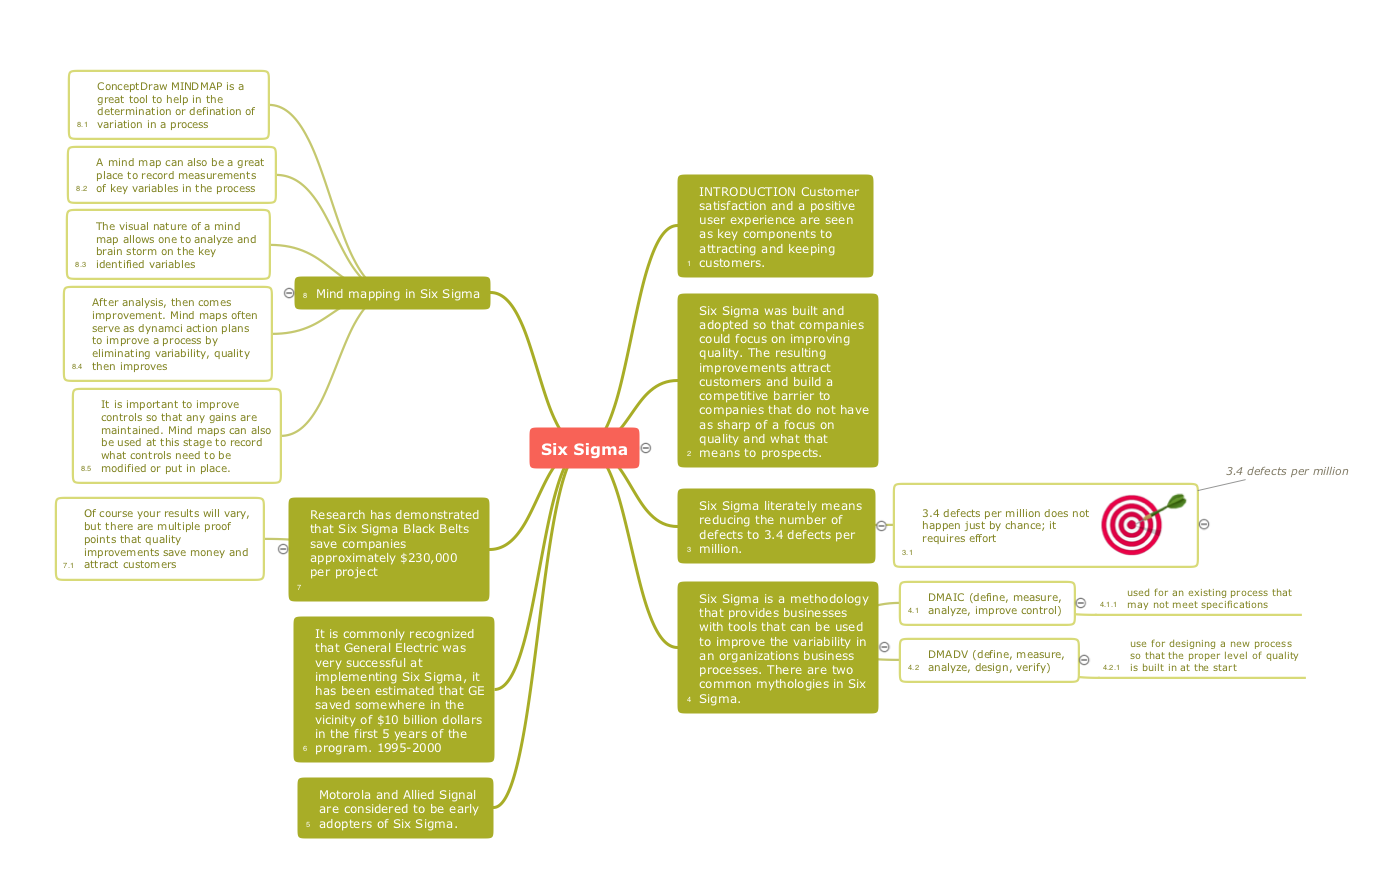
Quality Mind Maps - samples and templates
Fault Tree Analysis Software
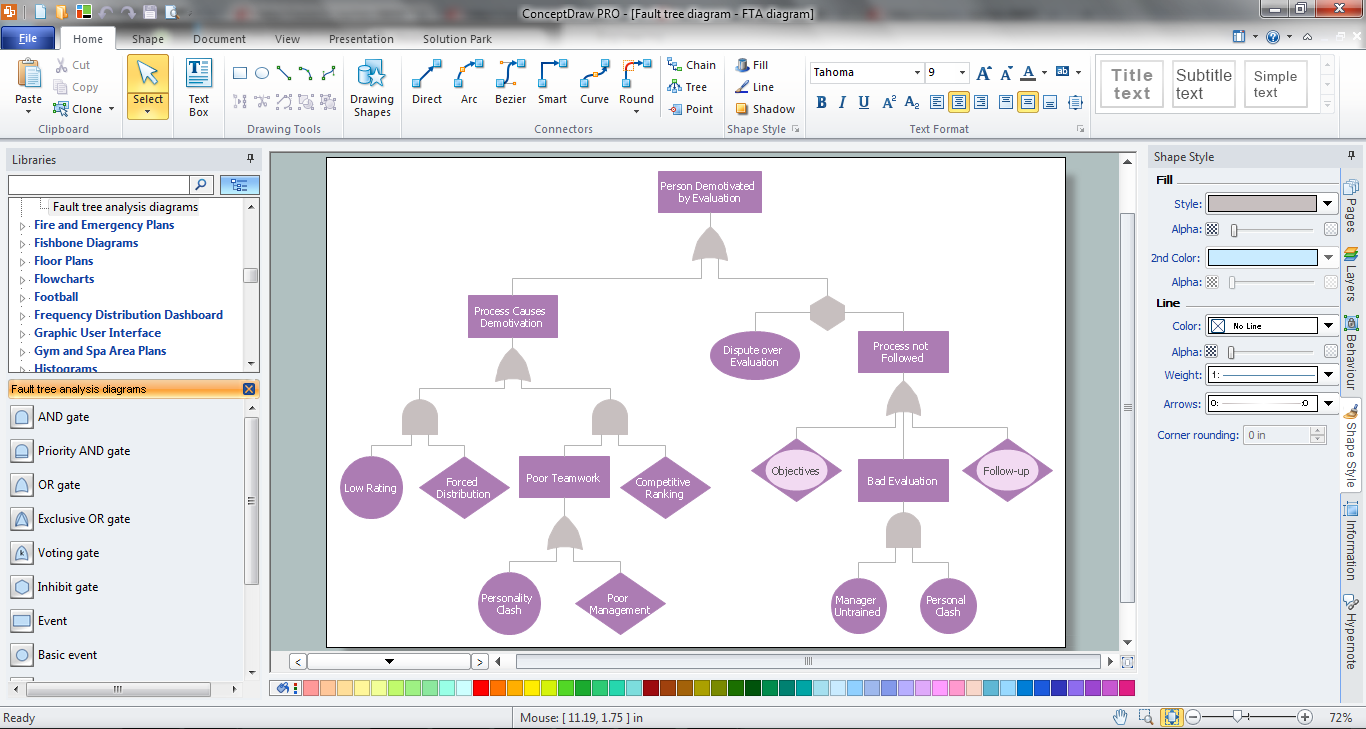
First of all, Fault Tree Analysis Diagrams Solution provides a set of samples which are the good examples of easy drawing professional looking Fault Tree Analysis Diagrams.
 ConceptDraw Solution Park
ConceptDraw Solution Park collects graphic extensions, examples and learning materials
7 Management & Planning Tools

Value-Stream Mapping for Manufacturing

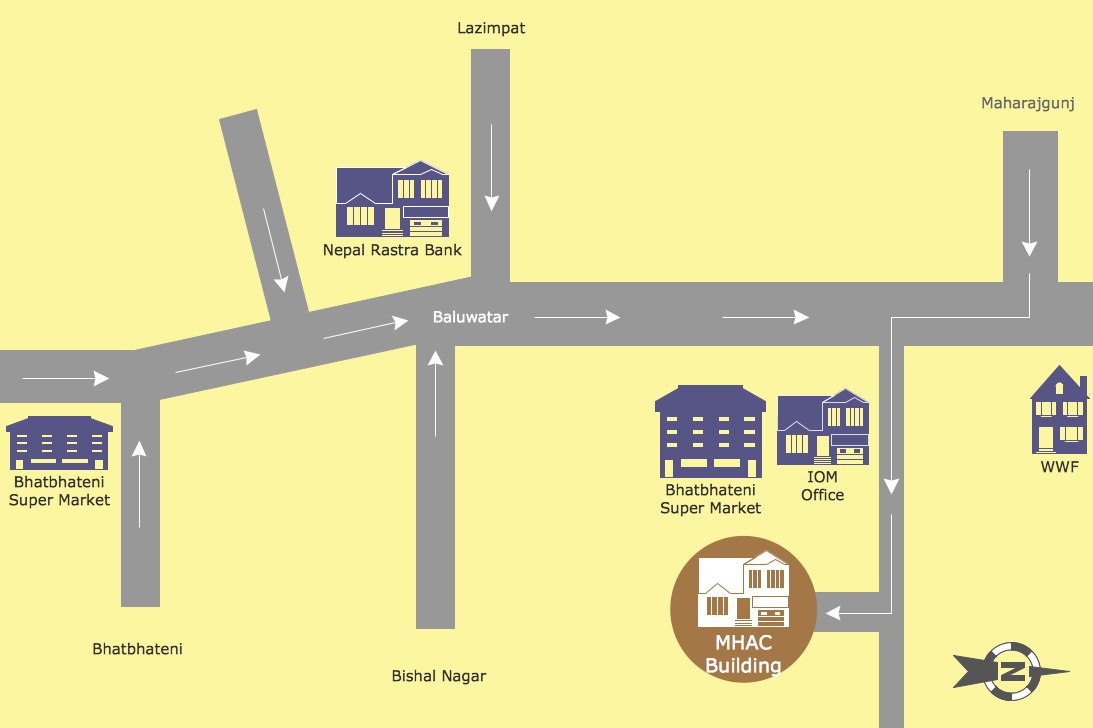
Map Directions
- Fishbone diagram - Bad coffee | Cause and effect diagram ...
- Ishikawa fishbone diagram | Fishbone diagram - Bad coffee | Cause ...
- Cause and effect diagram - Increase in productivity | Fishbone ...
- Fishbone Diagram | Cause and Effect Diagram | Fishbone Diagram ...
- Cause and effect diagram - Increase in productivity | Total Quality ...
- Cause and effect diagram - Increase in productivity | The Best ...
- Cause and effect diagram - Increase in productivity | Entity ...
- Cause and effect diagram - Increase in productivity | Cause and ...
- Cause and effect diagram - Increase in productivity | HR symbols ...
- Cause and effect diagram - Increase in productivity | Home area ...
- Cause and Effect Analysis | Cause and Effect Diagram Software ...
- Fishbone Diagram | Fishbone diagram - Bad coffee | Cause and ...
- Process Flowchart | Cause and effect diagram - Increase in ...
- Fishbone diagram - Template | Design elements - Cause-and-effect ...
- Fishbone Diagram | Cause and Effect Analysis - Fishbone Diagrams ...
- Cause And Effect Diagrams
- Fishbone Diagram | Fishbone Diagrams | How to Draw a Fishbone ...
- Cause and Effect Diagram | Ishikawa Diagram | Cause and Effect ...
- Cause and Effect Analysis - Fishbone Diagrams for Problem Solving ...
- Fishbone Diagram Purchasing
- ERD | Entity Relationship Diagrams, ERD Software for Mac and Win
- Flowchart | Basic Flowchart Symbols and Meaning
- Flowchart | Flowchart Design - Symbols, Shapes, Stencils and Icons
- Flowchart | Flow Chart Symbols
- Electrical | Electrical Drawing - Wiring and Circuits Schematics
- Flowchart | Common Flowchart Symbols
- Flowchart | Common Flowchart Symbols