This cause and effect diagram sample was redesigned from the Wikimedia Commons file: Ursache Wirkung Diagramm Beispiel.png. [commons.wikimedia.org/ wiki/ File:Ursache_ Wirkung_ Diagramm_ Beispiel.png]
This file is licensed under the Creative Commons Attribution-Share Alike 3.0 Unported license. [creativecommons.org/ licenses/ by-sa/ 3.0/ deed.en]
"Productivity is the ratio of output to inputs in production; it is an average measure of the efficiency of production. Efficiency of production means production’s capability to create incomes which is measured by the formula real output value minus real input value.
Productivity is a crucial factor in production performance of firms and nations. Increasing national productivity can raise living standards because more real income improves people's ability to purchase goods and services, enjoy leisure, improve housing and education and contribute to social and environmental programs. Productivity growth also helps businesses to be more profitable." [Productivity. Wikipedia]
The fishbone diagram example "Increase in productivity" was created using the ConceptDraw PRO diagramming and vector drawing software extended with the Fishbone Diagrams solution from the Management area of ConceptDraw Solution Park.
Ishikawa diagram

This cause and effect diagram sample was redesigned from the Wikimedia Commons file: Fishbone BadCoffeeExample.jpg. [commons.wikimedia.org/ wiki/ File:Fishbone_ BadCoffeeExample.jpg]
This file is licensed under the Creative Commons Attribution-Share Alike 3.0 Unported license. [creativecommons.org/ licenses/ by-sa/ 3.0/ deed.en]
The fishbone diagram example "Bad coffee" was created using the ConceptDraw PRO diagramming and vector drawing software extended with the Fishbone Diagrams solution from the Management area of ConceptDraw Solution Park.
Fishbone diagram

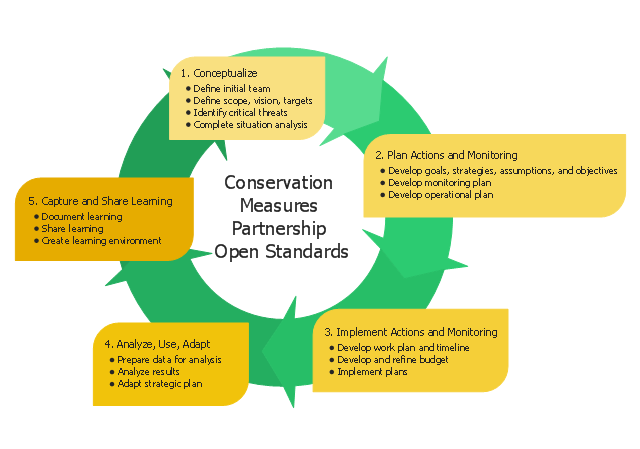
"Adaptive management (AM), also known as adaptive resource management (ARM), is a structured, iterative process of robust decision making in the face of uncertainty, with an aim to reducing uncertainty over time via system monitoring. In this way, decision making simultaneously meets one or more resource management objectives and, either passively or actively, accrues information needed to improve future management. Adaptive management is a tool which should be used not only to change a system, but also to learn about the system (Holling 1978). Because adaptive management is based on a learning process, it improves long-run management outcomes. The challenge in using the adaptive management approach lies in finding the correct balance between gaining knowledge to improve management in the future and achieving the best short-term outcome based on current knowledge (Allan & Stankey 2009).
Application to environmental projects and programs.
Open Standards for the Practice of Conservation lay out 5 main steps to an adaptive management project cycle. The Open Standards represent a compilation and adaptation of best practices and guidelines across several fields and across several organizations within the conservation community. Since the release of the initial Open Standards (updated in 2007), thousands of project teams from conservation organizations (e.g., TNC, Rare, and WWF), local conservation groups, and donors alike have begun applying these Open Standards to their work. In addition, several CMP members have developed training materials and courses to help apply the Standards.
Some recent write-ups of adaptive management in conservation include: wildlife protection (SWAP, 2008), forests ecosystem protection (CMER, 2010), coastal protection and restoration (LACPR, 2009), natural resource management (water, land and soil), species conservation especially, fish conservation from overfishing (FOS, 2007) and climate change (DFG, 2010)." [Adaptive management. Wikipedia]
This circular arrows diagram example was redesigned from the Wikipedia file: CMP Cycle - 2008-02-20.jpg.
[en.wikipedia.org/ wiki/ File:CMP_ Cycle_ -_ 2008-02-20.jpg]
The example "CMP adaptive management cycle" was created using the ConceptDraw PRO diagramming and vector drawing software extended with the Circular Arrows Diagrams solution from the area "What is a Diagram" of ConceptDraw Solution Park.
Circular arrows diagram
- Wiki Fishbone Diagram
- PROBLEM ANALYSIS. Root Cause Analysis Tree Diagram | Root ...
- Fishbone diagram - Bad coffee | Cause and effect diagram ...
- Fishbone diagram - Template | Design elements - Cause-and-effect ...
- Design elements - Cause-and-effect diagram | Ishikawa fishbone ...
- Ishikawa Diagram | Ishikawa fishbone diagram | How to Draw a ...
- How to Draw a Pareto Chart Using ConceptDraw PRO | Pareto ...
- Cause and Effect Analysis - Fishbone Diagrams for Problem Solving ...
- Seven Basic Tools of Quality - Fishbone Diagram | Fishbone ...
- Total Quality Management with ConceptDraw | Design elements ...
- How to Create a Fishbone (Ishikawa) Diagram Quickly ...
- Cause and Effect Analysis ( Fishbone Diagrams ) | Quality fishbone ...
- Manufacturing 8 Ms fishbone diagram - Template | How to Create a ...
- Draw Fishbone Diagram on MAC Software | How to Draw a ...
- Manufacturing 8 Ms fishbone diagram - Template | Fishbone ...
- Business Productivity Diagramming | Fishbone Diagrams | Fishbone ...
- Fishbone Diagram | Cause and Effect Analysis - Fishbone Diagrams ...
- Fishbone Diagram | Fishbone Diagrams | Manufacturing 8 Ms ...
- Ishikawa Diagram | How to Draw a Fishbone Diagram with ...
- Fishbone Diagram | Business Productivity Diagramming | Fishbone ...