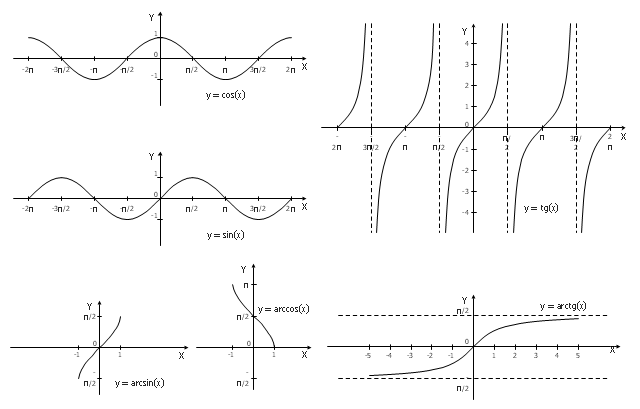
The vector stencils library "Trigonometric functions" contains 8 shapes of trigonometrical and inverse trigonometrical functions graphs.
"In mathematics, the trigonometric functions (also called the circular functions) are functions of an angle. They relate the angles of a triangle to the lengths of its sides. Trigonometric functions are important in the study of triangles and modeling periodic phenomena, among many other applications.
The most familiar trigonometric functions are the sine, cosine, and tangent. In the context of the standard unit circle with radius 1 unit, where a triangle is formed by a ray originating at the origin and making some angle with the x-axis, the sine of the angle gives the length of the y-component (the opposite to the angle or the rise) of the triangle, the cosine gives the length of the x-component (the adjacent of the angle or the run), and the tangent function gives the slope (y-component divided by the x-component). More precise definitions are detailed below. Trigonometric functions are commonly defined as ratios of two sides of a right triangle containing the angle, and can equivalently be defined as the lengths of various line segments from a unit circle. More modern definitions express them as infinite series or as solutions of certain differential equations, allowing their extension to arbitrary positive and negative values and even to complex numbers." [Trigonometric functions. Wikipedia]
The shapes example "Design elements - Trigonometric functions" was created using the ConceptDraw PRO diagramming and vector drawing software extended with the Mathematics solution from the Science and Education area of ConceptDraw Solution Park.
Trigonometrical and inverse trigonometrical functions - Graphs
Basic Flowchart Symbols and Meaning


 Cafe and Restaurant Floor Plans
Restaurants and cafes are popular places for recreation, relaxation, and are the scene for many impressions and memories, so their construction and design requires special attention. Restaurants must to be projected and constructed to be comfortable and e
 Mathematics
Mathematics solution extends ConceptDraw PRO software with templates, samples and libraries of vector stencils for drawing the mathematical illustrations, diagrams and charts.
 Gym and Spa Area Plans
Effective promotion of spa complexes, spa resorts, fitness centers, and gym rooms requires professional, detailed, illustrative and attractive spa floor plan, gym floor plan, and other fitness plans designs. They are designed to display common plans of premises, design, Spa furniture, gym and exercise equipment layout, and pools location.
Diagramming Software for Design Business Process Diagrams
")

HelpDesk
How to Create a Seating Chart for Wedding or Event

Process Flowchart


Block Diagram

Use the libraries from the Block Diagrams solution to draw block diagrams for your business documents, presentations and websites in a few minutes.
HelpDesk
How to Draw a Block Diagram in ConceptDraw PRO

 Business Package for Management
Package intended for professional who designing and documenting business processes, preparing business reports, plan projects and manage projects, manage organizational changes, prepare operational instructions, supervising specific department of an organization, workout customer service processes and prepare trainings for customer service personal, carry out a variety of duties to organize business workflow.
Functional Block Diagram

Types of Flowchart - Overview


Electrical Symbols — Electrical Circuits

Electrical and electronic circuits can be complicated. Making a drawing of the connections to all the component parts in the circuit's load makes it easier to understand how circuit components are connected. Drawings for electronic circuits are called "circuit diagrams". Drawings for electrical circuits are called "wiring diagrams".
26 libraries of the Electrical Engineering Solution of ConceptDraw PRO make your electrical diagramming simple, efficient, and effective. You can simply and quickly drop the ready-to-use objects from libraries into your document to create the electrical diagram.
- Design elements - Trigonometric functions | Trigonometric functions ...
- Design elements - Trigonometric functions | Mathematics | Sine ...
- Design elements - Trigonometric functions | Sine function ...
- Example Of Elements Of Function
- Trigonometric functions - Vector stencils library | Design elements ...
- Sine function | How to Use the Export To PowerPoint Function in ...
- Design elements - Education charts | Line Graph | How to Create a ...
- Design elements - Education charts | SWOT and TOWS Matrix ...
- Bubble diagrams with ConceptDraw PRO | Bubble diagrams in ...
- Watercraft - Design Elements | Marketing - Design Elements ...
- Design elements - Picture graphs | Design elements - Line graphs ...
- Design elements - Picture bar graphs | Design elements - Scatter ...
- Ray tracing diagram for concave lens
- Mathematics Symbols | Solid geometry - Vector stencils library ...
- Mathematics Symbols | Mathematical Diagrams | Mathematics ...
- Mathematics Symbols | Mathematics | Mathematical Diagrams ...
- Mathematics Symbols | Design elements - Solid geometry | Scientific ...
- Design elements - Solid geometry | Mathematics Symbols | Scientific ...
- Mathematics | Mathematical Diagrams | Basic Diagramming ...
- Design elements - Solid geometry | Scientific Symbols Chart ...
- ERD | Entity Relationship Diagrams, ERD Software for Mac and Win
- Flowchart | Basic Flowchart Symbols and Meaning
- Flowchart | Flowchart Design - Symbols, Shapes, Stencils and Icons
- Flowchart | Flow Chart Symbols
- Electrical | Electrical Drawing - Wiring and Circuits Schematics
- Flowchart | Common Flowchart Symbols
- Flowchart | Common Flowchart Symbols