How To Make a Bubble Chart
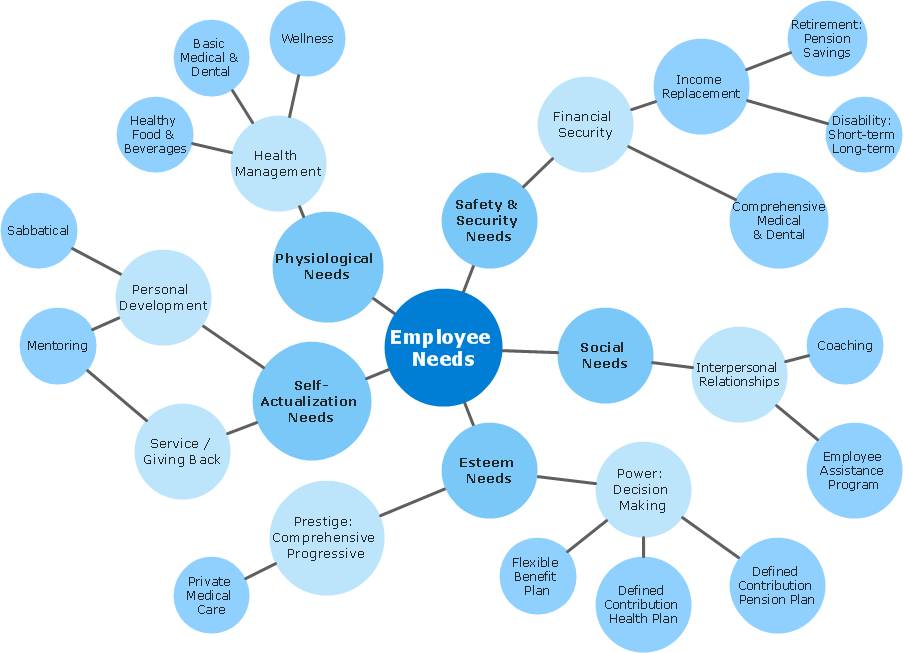
Bubble diagrams solution extends ConceptDraw PRO software with templates, Using ConceptDraw Connectors, you can make a bubble chart in moments. Using ConceptDraw you will be able to make a bubble chart from the ready ConceptDraw library objects or make your own objects. The created diagram can represent ideas organization, in brainstorming processes, by teachers for explaining difficult ideas or for presentations.ConceptDraw Arrows10 Technology
Connecting objects manually in ConceptDraw PRO is a snap:- points;
- Connecting groups of objects;
- Auto-routing;
- Connectors text;
- Snap to Guides ;
- Quick.
ConceptDraw Arrows10 Technology
Auto-connection mode - This is more than enough versatility to draw any type of diagram with any degree of complexity.How should diagramming software work? Is it possible to develop a diagram as quickly as the ideas come to you? The innovative Auto-connection mode is what you need to start draw.
HelpDesk
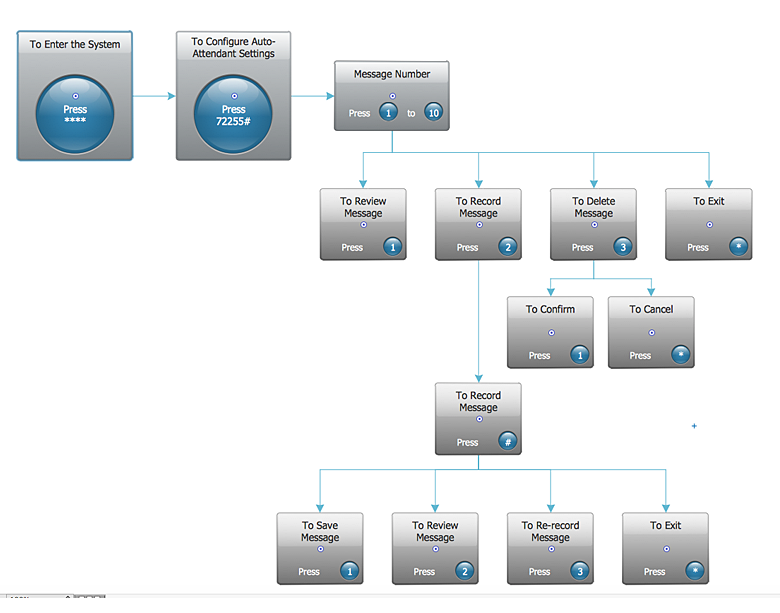
How to Create an Interactive Voice Response (IVR) Diagram in ConceptDraw PRO
Interactive Voice Response (IVR) System is a telecommunication technology that enables a computer to automatically process voice and touch phone signals. IVR systems allows users to interact through a computer with various service systems, available by telephone. The objective of IVR system is to reduce customer service costs by delivering self service to customers and guiding them to the information that they look for. Interactive Voice Response (IVR) Diagram is used to create and conduct the Interactive Voice Response systems for call-centers and voice mail services. IVR diagrams intended to visualize the logical and physical structure of Interactive voice response systems. ConceptDraw solution for Interactive Voice Response (IVR) Diagram allows you to create and communicate the Interactive Voice Response diagram of any complexity.
 Interactive Voice Response Diagrams
Interactive Voice Response Diagrams solution extends ConceptDraw PRO v10 software with samples, templates and libraries of ready-to-use vector stencils that help create Interactive Voice Response (IVR) diagrams illustrating in details a work of interactive voice response system, the IVR system’s logical and physical structure, Voice-over-Internet Protocol (VoIP) diagrams, and Action VoIP diagrams with representing voice actions on them, to visualize how the computers interact with callers through voice recognition and dual-tone multi-frequency signaling (DTMF) keypad inputs.
Create Block Diagram
Block diagrams solution extends ConceptDraw PRO software with templates, samples and libraries of vector stencils for creating the block diagram.Create block diagrams, electrical circuit diagrams, schematics, and more in minutes with ConceptDraw PRO.
Process Flowchart
ConceptDraw is Professional business process mapping software for making process flow diagram, workflow diagram, general flowcharts and technical illustrations for business documents. It is includes rich examples, templates, process flowchart symbols. ConceptDraw flowchart maker allows you to easier create a process flowchart. Use a variety of drawing tools, smart connectors, flowchart symbols and shape libraries to create flowcharts of complex processes, process flow diagrams, procedures and information exchange.
HelpDesk
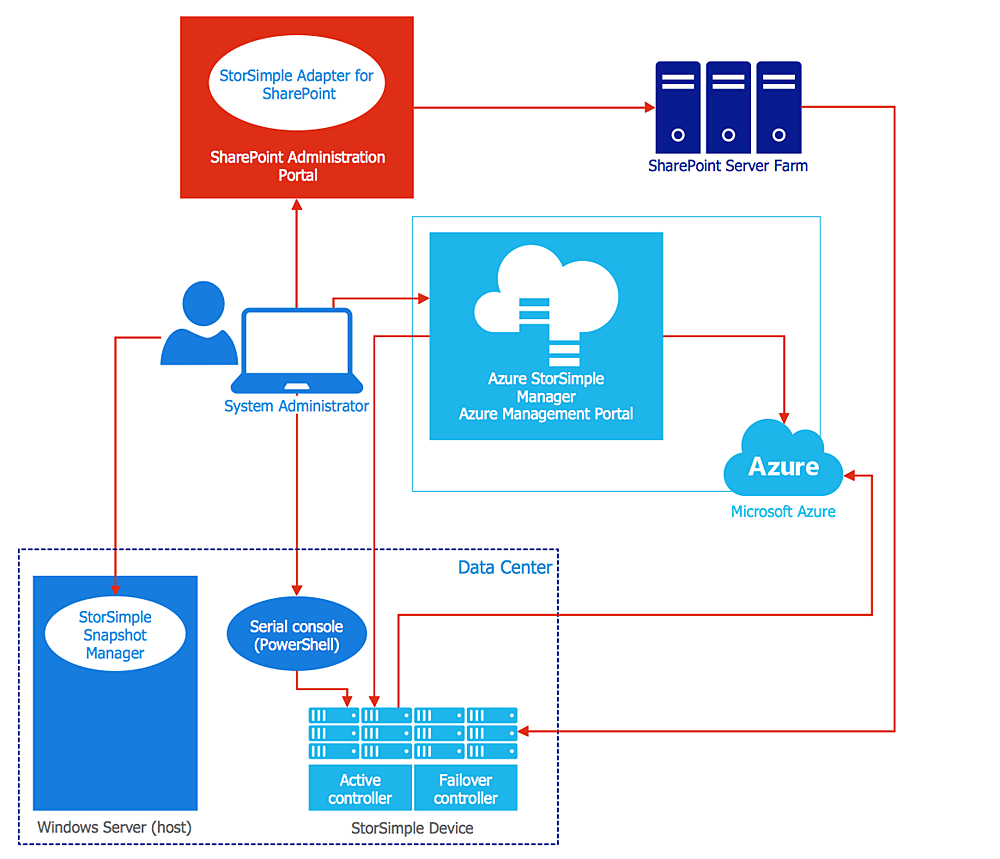
How to Create an Azure Architecture Diagram Using ConceptDraw PRO
Microsoft Azure is an open cloud computing platform, designed by Microsoft. It provides the ability to develop and launch applications and to store data on servers in distributed data centers. Microsoft Azure cloud offers two models - platform as a service (PaaS) and infrastructure as a service (IaaS). The efficiency of the Windows Azure platform is supported by a global network of Microsoft data centers. Developers use Azure Architecture diagrams to visualize and document the architecture of applications bases on Microsoft Azure services. Using the ConceptDraw Azure Architecture solution makes much easier the work on documenting the Microsoft Azure architecture.
 Computer and Networks Area
The solutions from Computer and Networks Area of ConceptDraw Solution Park collect samples, templates and vector stencils libraries for drawing computer and network diagrams, schemes and technical drawings.
Structured Systems Analysis and Design Method (SSADM) with ConceptDraw PRO
Structured Systems Analysis and Design Method SSADM is the method which is used at projecting and analysis of information systems. SSADM is based on the data flow diagrams. At the description of data flows out of the system and into the system DFD, which denote boundaries of the system, are used.
 Meter Dashboard
Meter dashboard solution extends ConceptDraw PRO software with templates, samples and vector stencils library with meter indicators for drawing visual dashboards showing quantitative data.
Organogram Software
Organizing process is the process of creating the organizational structure of an enterprise. The organizing process consists of several stages. First, you need to divide the organization into departments, respectively to strategies, and then establish relationships of authority. After that, managing director delegates his rights and authorities.- Bubble Diagram Of Business Center
- How to Draw an Organization Chart | How to Draw a Bubble Chart ...
- Bubble Diagrams Of Hotel Drawing
- Example Of A Shopping Mall Bubble Diagram
- Bubble diagrams in Landscape Design with ConceptDraw PRO ...
- Office Layout Plans | How to Draw a Bubble Chart | How to Draw an ...
- Bubble diagrams in Landscape Design with ConceptDraw PRO
- Create Block Diagram | Entity-Relationship Diagram (ERD) | Draw ...
- Bubble diagrams in Landscape Design with ConceptDraw PRO ...
- Bubble diagrams in Landscape Design with ConceptDraw PRO ...
- Bubble diagrams in Landscape Design with ConceptDraw PRO ...
- Bubble diagrams in Landscape Design with ConceptDraw PRO ...
- How to Draw an Organization Chart | Cubetto Flowchart ...
- Bubble Diagram For A Shopping Complex
- Bubble Diagram For Cafe
- Call center network diagram | Interactive Voice Response Diagrams ...
- Bubble Chart | Office Layout Plans | CAD Drawing Software for ...
- Bubble Chart Maker | Classroom Seating Chart Maker | How to ...
- ConceptDraw Arrows10 Technology | ConceptDraw Arrows10 ...
- EFS Operation | ConceptDraw Arrows10 Technology | Flow chart ...
- ERD | Entity Relationship Diagrams, ERD Software for Mac and Win
- Flowchart | Basic Flowchart Symbols and Meaning
- Flowchart | Flowchart Design - Symbols, Shapes, Stencils and Icons
- Flowchart | Flow Chart Symbols
- Electrical | Electrical Drawing - Wiring and Circuits Schematics
- Flowchart | Common Flowchart Symbols
- Flowchart | Common Flowchart Symbols


