HelpDesk
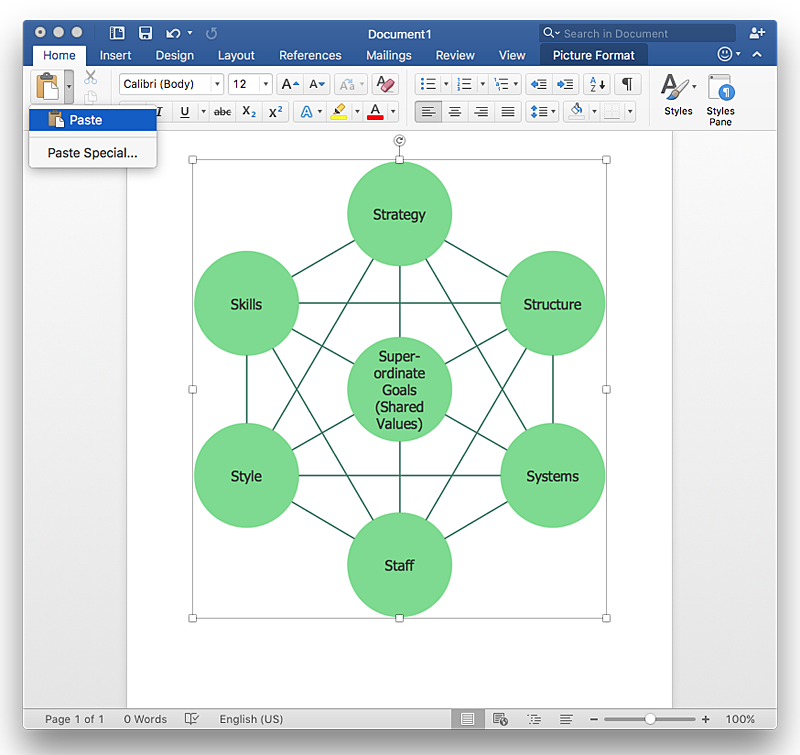
How to Add a Bubble Diagram to a MS Word Document Using ConceptDraw PRO
A bubble chart is a diagram in which the data points are replaced with bubbles, and the size of the bubbles represents some additional dimension of the data. A bubble chart does not have the axis. A bubble chart can be used instead of a scatter diagram if the data has three dimensions, each of that containing the set of values. The sizes of the bubbles are determined by the values in the third dimension. Any additional information about the entities beyond their three primary dimensions can be depicted by rendering bubbles in colors and patterns that are selected in a certain way. The legend containing the further information can be added to a bubble diagram. ConceptDraw PRO allows you to easily create various business management and marketing charts, including bubble diagrams and then add them to a MS Word document.
 Office Layout Plans
Office layouts and office plans are a special category of building plans and are often an obligatory requirement for precise and correct construction, design and exploitation office premises and business buildings. Designers and architects strive to make office plans and office floor plans simple and accurate, but at the same time unique, elegant, creative, and even extraordinary to easily increase the effectiveness of the work while attracting a large number of clients.
 Bubble Diagrams
Bubble diagrams have enjoyed great success in software engineering, architecture, economics, medicine, landscape design, scientific and educational process, for ideas organization during brainstorming, for making business illustrations, presentations, planning, design, and strategy development. They are popular because of their simplicity and their powerful visual communication attributes.
HelpDesk
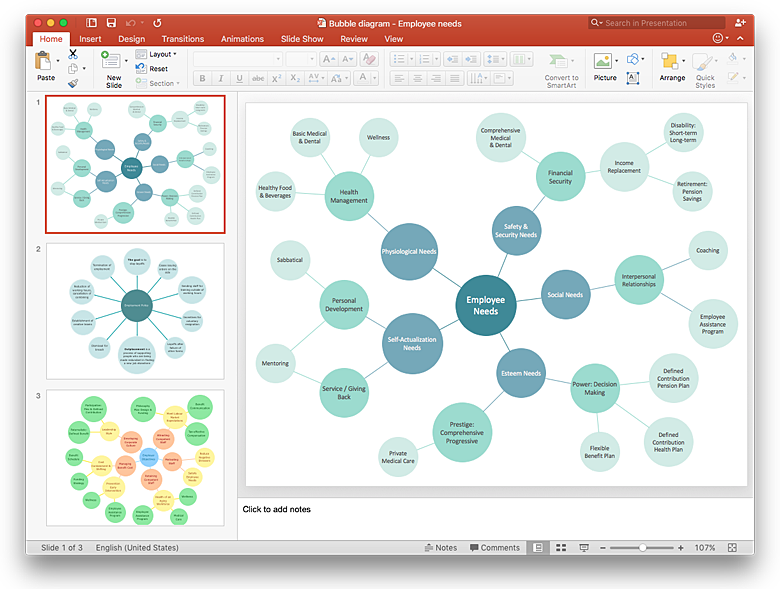
How to Add a Bubble Diagram to a PowerPoint Presentation Using ConceptDraw PRO
Bubble diagrams can be used to compare concepts, and identify areas of similarity and difference. ConceptDraw PRO allows you to make a MS PowerPoint Presentation from your charts in a few simple steps.HelpDesk
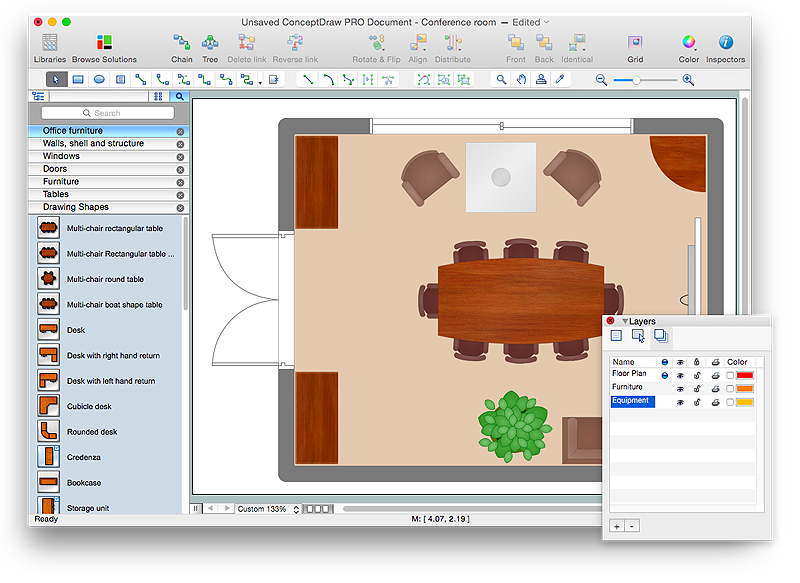
How to Draw a Floor Plan for Your Office
Designing the right office space is is an essential factor of business productivity. An office floor plan should reflect the needs of both employees and customers. ConceptDraw PRO allows you to draw the Floor Plan for your office using a special office equipment library as well as set of special objects that displays the sizes, corners, squares and other floor plan details.- Bubble And Line Diagram Of Bank Office
- Bubble Diagrams For An Office Design
- How to Draw a Bubble Chart | Office Layout Plans | Building ...
- Bubble Diagrams | How to Add a Bubble Diagram to a PowerPoint ...
- Bubble Chart | Office Layout Plans | How to Draw a Bubble Chart ...
- Bubble Diagram For Office Complex
- Architectural Bubble Diagram Maker For Office Layout
- Bubble diagrams in Landscape Design with ConceptDraw PRO ...
- Bubble Diagram Of Architects Office
- Bubble diagrams with ConceptDraw PRO | Bubble Chart | How To ...
- Bubble Diagram Showing Sequence Of Arrangment Of Area
- Interior Design Office Layout Plan Design Element | Bubble Diagram ...
- ConceptDraw Solution Park | Bubble Diagrams | Office Layout Plans ...
- Design elements - Bubble diagrams | How to Add a Bubble Diagram ...
- How To Make a Bubble Chart | UML Class Diagram Example ...
- Office Building Bubble Diagram
- Office Layout Plans | Bubble Diagrams | Reflected Ceiling Plans ...
- Bubble Diagram Of Post Office
- Offices Green Building Bubble Diagram


