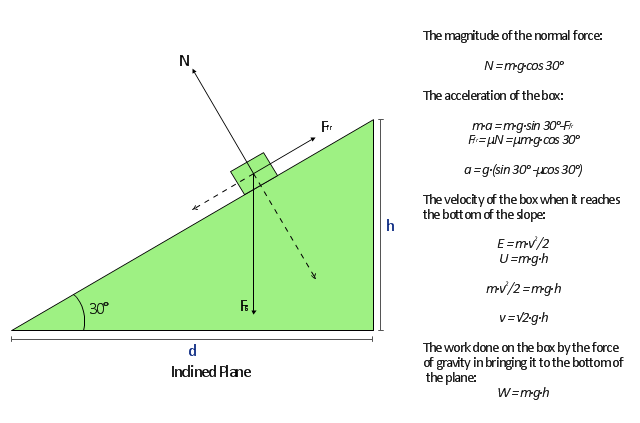
"A free body diagram, sometimes called a force diagram, is a pictorial device, often a rough working sketch, used by engineers and physicists to analyze the forces and moments acting on a body. The body itself may consist of multiple components, an automobile for example, or just a part of a component, a short section of a beam for example, anything in fact that may be considered to act as a single body, if only for a moment. A whole series of such diagrams may be necessary to analyze forces in a complex problem. The free body in a free body diagram is not free of constraints, it is just that the constraints have been replaced by arrows representing the forces and moments they generate." [Free body diagram. Wikipedia]
The free-body diagram example was created using the ConceptDraw PRO diagramming and vector drawing software extended with the Physics solution from the Science and Education area of ConceptDraw Solution Park.
The free-body diagram example was created using the ConceptDraw PRO diagramming and vector drawing software extended with the Physics solution from the Science and Education area of ConceptDraw Solution Park.
Free-body diagram
Physics Diagrams

 Physics
Physics solution extends ConceptDraw DIAGRAM software with templates, samples and libraries of vector stencils for drawing the physical illustrations, diagrams and charts.
Astronomy Symbols

Entity-Relationship Diagram (ERD) with ConceptDraw DIAGRAM
 <br>with ConceptDraw DIAGRAM *")

CAD Drawing Software for Making Mechanic Diagram and Electrical Diagram Architectural Designs


Business diagrams & Org Charts with ConceptDraw DIAGRAM


UML Diagramming Software

 Human Anatomy
Human Anatomy solution extends ConceptDraw DIAGRAM functionality with best tools to design diagrams and illustrations for using in a sphere of medicine and health care, infographics on the human physiology and anatomy thematic, to represent the structure of male and female bodies from the front and back views, description in details any of physiological systems of the human organism, such as central and peripheral nervous systems, respiratory system, cardiovascular system, digestive system, endocrine system, reproductive system, urinary system, skeletal system, muscular system, integumentary system, lymphatic system, sensory system, visual system, immune system.
Pyramid Diagram

Electrical Symbols — MOSFET

Electrical Diagram

Diagramming Software for UML Composite Structure Diagrams


Create Sophisticated Professional Diagrams - Simply

Lean Six Sigma Diagram Software

 Entity-Relationship Diagram (ERD)
An Entity-Relationship Diagram (ERD) is a visual presentation of entities and relationships. That type of diagrams is often used in the semi-structured or unstructured data in databases and information systems. At first glance ERD is similar to a flowch
UML Composite Structure Diagram

 Jackson Structured Programming (JSP) Diagrams
The Jackson Structured Programming (JSP) Diagram solution extends the functionality and drawing abilities of the ConceptDraw DIAGRAM software with set of illustrative JSP diagrams samples and large variety of predesigned vector objects of actions, processes, procedures, selection, iteration, as well as arrows and connectors to join the objects during Jackson structured development and designing Jackson structured programming diagrams, JSP diagram, Jackson structure diagram (JSD), Program structure diagram. The powerful abilities of this solution make the ConceptDraw DIAGRAM ideal assistant for programmers, software developers, structural programmers, computer engineers, applications constructors, designers, specialists in structured programming and Jackson systems design, and other technical, computer and software specialists.
Polar Graph

 Object-Role Modeling (ORM) Diagrams
Object-role Modeling (ORM) Diagram solution with powerful vector diagramming and data modeling tools, large quantity of specially developed samples and examples, and rich variety of vector objects corresponding to common ORM notation, ideally suits for developing the comprehensive, clear and visual Object-role Modeling (ORM) diagrams and schematics, understandable for all interested people from the different fields and business directions, for designing the ORM models, and demonstrating advantages from the use of ORM and its notation. It is intended for software developers and computer engineers, specialists in a field of Object-oriented programming (OOP), database architects, web-application constructors and developers, etc.
- Free Body Diagram Drawing Software
- Physics Diagrams | How to Draw Physics Diagrams | Stakeholder ...
- Physics | Fishbone Diagram | Rapid UML | Free Body Diagram ...
- Free Body Diagram Software
- Free- body diagram | How to Draw Physics Diagrams in ...
- Physics Diagrams | Physics Symbols | Basic Diagramming Flowchart ...
- Free- body diagram | Physics Diagrams | How to Draw Physics ...
- Network Diagram Examples | Rack Diagrams | Free- body diagram ...
- Free Body Diagram Download
- Physics | Ice Hockey Offside Diagram | Free Body Diagram Concept
- Free- body diagram | Physics | How to Draw Physics Diagrams in ...
- Physics Diagrams | How to Draw Physics Diagrams in ConceptDraw ...
- Physics | Physics Diagrams | How to Draw Physics Diagrams | What ...
- Physics | Physics Diagram Software Free Download For Pc
- Free- body diagram | Mechanics - Vector stencils library | Physics ...
- Physics Diagrams | Physics | How to Draw Physics Diagrams | Free ...
- How to Draw Physics Diagrams in ConceptDraw PRO | Block ...
- Biology Drawing Software | Physics Diagrams | Chemistry Drawing ...
- Sequence The Steps In Drawing A Free Body Diagram