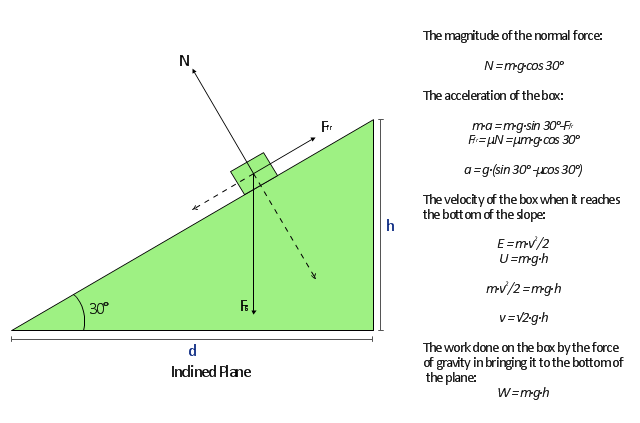
"A free body diagram, sometimes called a force diagram, is a pictorial device, often a rough working sketch, used by engineers and physicists to analyze the forces and moments acting on a body. The body itself may consist of multiple components, an automobile for example, or just a part of a component, a short section of a beam for example, anything in fact that may be considered to act as a single body, if only for a moment. A whole series of such diagrams may be necessary to analyze forces in a complex problem. The free body in a free body diagram is not free of constraints, it is just that the constraints have been replaced by arrows representing the forces and moments they generate." [Free body diagram. Wikipedia]
The free-body diagram example was created using the ConceptDraw PRO diagramming and vector drawing software extended with the Physics solution from the Science and Education area of ConceptDraw Solution Park.
The free-body diagram example was created using the ConceptDraw PRO diagramming and vector drawing software extended with the Physics solution from the Science and Education area of ConceptDraw Solution Park.
Free-body diagram
Physics Diagrams

 Physics
Physics solution extends ConceptDraw DIAGRAM software with templates, samples and libraries of vector stencils for drawing the physical illustrations, diagrams and charts.
 Human Anatomy
Human Anatomy solution extends ConceptDraw DIAGRAM functionality with best tools to design diagrams and illustrations for using in a sphere of medicine and health care, infographics on the human physiology and anatomy thematic, to represent the structure of male and female bodies from the front and back views, description in details any of physiological systems of the human organism, such as central and peripheral nervous systems, respiratory system, cardiovascular system, digestive system, endocrine system, reproductive system, urinary system, skeletal system, muscular system, integumentary system, lymphatic system, sensory system, visual system, immune system.
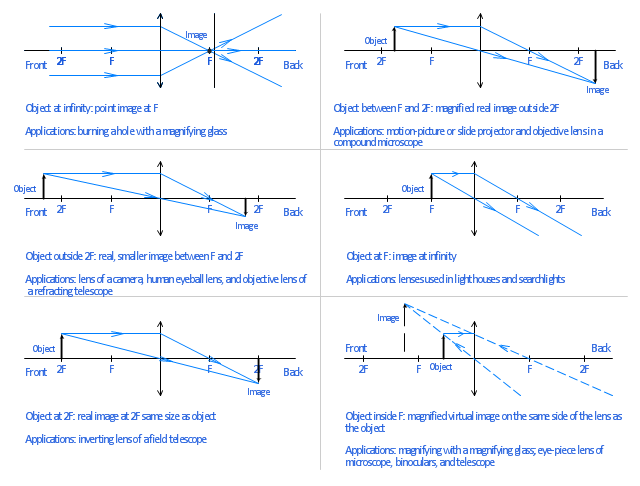
"A lens is an optical device which transmits and refracts light, converging or diverging the beam. A simple lens consists of a single optical element. A compound lens is an array of simple lenses (elements) with a common axis; the use of multiple elements allows more optical aberrations to be corrected than is possible with a single element. Lenses are typically made of glass or transparent plastic. Elements which refract electromagnetic radiation outside the visual spectrum are also called lenses: for instance, a microwave lens can be made from paraffin wax.
The variant spelling lense is sometimes seen. While it is listed as an alternative spelling in some dictionaries, most mainstream dictionaries do not list it as acceptable." [Lens (optics). Wikipedia]
The example "Ray tracing diagram for convex lens" was created using the ConceptDraw PRO diagramming and vector drawing software extended with the Physics solution from the Science and Education area of ConceptDraw Solution Park.
Ray tracing diagram
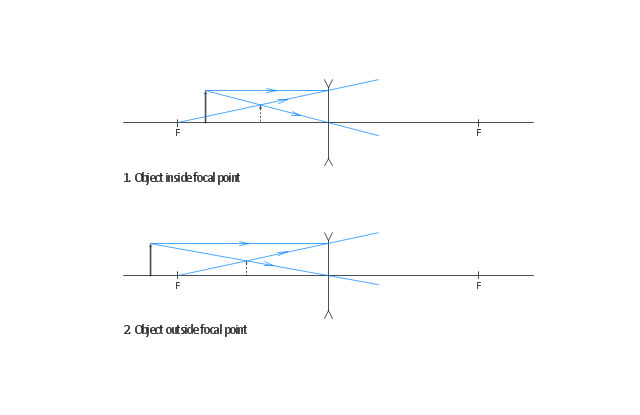
"In physics, ray tracing is a method for calculating the path of waves or particles through a system with regions of varying propagation velocity, absorption characteristics, and reflecting surfaces. Under these circumstances, wavefronts may bend, change direction, or reflect off surfaces, complicating analysis. Ray tracing solves the problem by repeatedly advancing idealized narrow beams called rays through the medium by discrete amounts. Simple problems can be analyzed by propagating a few rays using simple mathematics. More detailed analyses can be performed by using a computer to propagate many rays.
When applied to problems of electromagnetic radiation, ray tracing often relies on approximate solutions to Maxwell's equations that are valid as long as the light waves propagate through and around objects whose dimensions are much greater than the light's wavelength. Ray theory does not describe phenomena such as interference and diffraction, which require wave theory (involving the phase of the wave)." [Ray tracing (physics). Wikipedia]
The example "Ray tracing diagram for concave lens" was created using the ConceptDraw PRO diagramming and vector drawing software extended with the Physics solution from the Science and Education area of ConceptDraw Solution Park.
Ray tracing diagram
Pyramid Diagram

 Health Package
Health Package is a set of multifaceted solutions intended for visualization and illustration in a field of medicine and health, for drawing colorful, interesting and precise illustrations and infographics that will be used successfully in medical documents, articles, special magazines, posters, billboards, websites, presentations, collages. Having these solutions available, it will not be difficult to illustrate the medical editions, to convey the information in a full and interesting form, to teach students with use effective visual methods, to describe the medical facts, to tell about innovations in a field of medicine, health and correct nutrition, to explain the causes and consequences of different diseases, as well as the measures of their prevention and treatment.
Electrical Symbols — MOSFET

HelpDesk
How to Make Medical Illustrations

You can easily create a variety of healthcare-related visualizations: diagrams, infographics, illustrations etc. The set of ready-to-use samples can be helpful for making slides for presentations and slide-shows, infographics on the human physiology and anatomy thematic.
 Healthcare Management Workflow Diagrams
Healthcare Management Workflow Diagrams solution contains large set of colorful samples and libraries with predesigned vector pictograms and symbols of health, healthcare equipment, medical instruments, pharmaceutical tools, transport, medication, departments of healthcare organizations, the medical icons of people and human anatomy, as well as the predesigned flowchart objects, connectors and arrows, which make it the best for designing clear and comprehensive Medi?al Workflow Diagrams and Block Diagrams, Healthcare Management Flowcharts and Infographics, Healthcare Workflow Diagram, for depicting the healthcare workflow and clinical workflows in healthcare, for making the workflow analysis healthcare and healthcare workflow management.
Baseball Diagram — Baseball Field — Corner View — Sample

 People
This solution extends ConceptDraw DIAGRAM software with samples, templates and libraries of vector clipart for drawing the People illustrations. Use it to make professional-looking documents, presentations and websites illustrated with color scalable vector c
 Bar Graphs
The Bar Graphs solution enhances ConceptDraw DIAGRAM functionality with templates, numerous professional-looking samples, and a library of vector stencils for drawing different types of Bar Graphs, such as Simple Bar Graph, Double Bar Graph, Divided Bar Graph, Horizontal Bar Graph, Vertical Bar Graph, and Column Bar Chart.
 Pharmacy Illustrations
Pharmacy Illustrations solution with improbable quantity of predesigned vector objects and icons of pharmacy symbols, medical and health products, pharmacy images of drugstore products, pharmacy clipart of medication tools, pharmacy logo, and other pharmacy pictures is the best for designing the pharmacy illustrations of varied kinds, pharmacy and medical diagrams and schematics, for making the presentation slides and posters on the medical, pharmacy, pharmacology and pharmaceutical thematics, for designing the illustrative materials about ways of prevention diseases and also treatment them, for creation colorful illustrations helpful in newborn and baby care, the infographics and collages to be presented at the premises of medical establishments and during the lectures at the medical education institutions, also on the billboards and in other advertising materials.
 Object-Role Modeling (ORM) Diagrams
Object-role Modeling (ORM) Diagram solution with powerful vector diagramming and data modeling tools, large quantity of specially developed samples and examples, and rich variety of vector objects corresponding to common ORM notation, ideally suits for developing the comprehensive, clear and visual Object-role Modeling (ORM) diagrams and schematics, understandable for all interested people from the different fields and business directions, for designing the ORM models, and demonstrating advantages from the use of ORM and its notation. It is intended for software developers and computer engineers, specialists in a field of Object-oriented programming (OOP), database architects, web-application constructors and developers, etc.
"A Guide to the Project Management Body of Knowledge - Fifth Edition provides guidelines for managing individual projects and defines project management related concepts. It also describes the project management life cycle and its related processes, as well as the project life cycle.
The Guide recognizes 47 processes that fall into five basic process groups and ten knowledge areas that are typical of almost all projects.
The five process groups are:
Initiating,
Planning,
Executing,
Monitoring and Controlling,
Closing.
The ten knowledge areas are:
Project Integration Management,
Project Scope Management,
Project Time Management,
Project Cost Management,
Project Quality Management,
Project Human Resource Management,
Project Communications Management,
Project Risk Management,
Project Procurement Management,
Project Stakeholders Management (added in 5th edition).
Each of the ten knowledge areas contains the processes that need to be accomplished within its discipline in order to achieve an effective project management program. Each of these processes also falls into one of the five basic process groups, creating a matrix structure such that every process can be related to one knowledge area and one process group." [A Guide to the Project Management Body of Knowledge. Wikipedia]
The flow chart example "Project management life cycle" was created using the ConceptDraw PRO diagramming and vector drawing software extended with the Flowcharts solution from the area "What is a Diagram" of ConceptDraw Solution Park.
Flowchart - Project management life cycle

This circle diagram sample was redesigned from the Wikimedia Commons file: Research cycle.png. "Some of the basic elements of the scientific method, arranged in a cycle to emphasize that it is an iterative process." [commons.wikimedia.org/ wiki/ File:Research_ cycle.png]
This file is licensed under the Creative Commons Attribution 2.0 Generic license. [creativecommons.org/ licenses/ by/ 2.0/ deed.en]
"The scientific method is a body of techniques for investigating phenomena, acquiring new knowledge, or correcting and integrating previous knowledge. To be termed scientific, a method of inquiry must be based on empirical and measurable evidence subject to specific principles of reasoning. ...
Four essential elements of the scientific method are iterations, recursions, interleavings, or orderings of the following:
(1) Characterizations (observations, definitions, and measurements of the subject of inquiry).
(2) Hypotheses (theoretical, hypothetical explanations of observations and measurements of the subject).
(3) Predictions (reasoning including logical deduction from the hypothesis or theory).
(4) Experiments (tests of all of the above)...
A linearized, pragmatic scheme of the four points above is sometimes offered as a guideline for proceeding:
(1) Define a question.
(2) Gather information and resources (observe).
(3) Form an explanatory hypothesis.
(4) Test the hypothesis by performing an experiment and collecting data in a reproducible manner.
(5) Analyze the data.
(6) Interpret the data and draw conclusions that serve as a starting point for new hypothesis.
(7) Publish results.
(8) Retest (frequently done by other scientists).
The iterative cycle inherent in this step-by-step method goes from point 3 to 6 back to 3 again." [Scientific method. Wikipedia]
The circle diagram example "Research cycle" was created using the ConceptDraw PRO diagramming and vector drawing software extended with the Target and Circular Diagrams solution from the Marketing area of ConceptDraw Solution Park.
www.conceptdraw.com/ solution-park/ marketing-target-and-circular-diagrams
Circle diagram

CCTV Surveillance System Diagram. CCTV Network Diagram Example

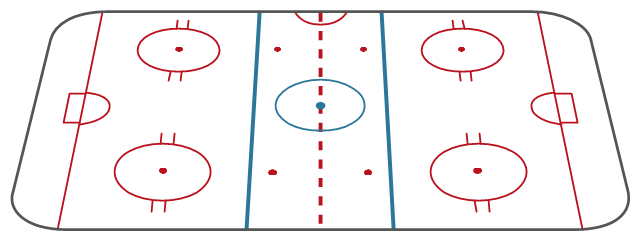
"Markings.
Lines.
The centre line divides the ice in half crosswise. It is used to judge icing, meaning that if a team sends the puck across the centre line (red line), blue line and then across the goal line (that is to say, shoots or dumps the puck past the goal line from behind their own side of the centre line) it is said to be icing. ...
Faceoff spots and circles.
There are 9 faceoff spots on a hockey rink. Most faceoffs take place at these spots. There are two spots in each end zone, two at each end of the neutral zone, and one in the centre of the rink.
There are faceoff circles around the centre ice and end zone faceoff spots. There are hash marks painted on the ice near the end zone faceoff spots. The circles and hash marks show where players may legally position themselves during a faceoff or in game play. ...
Spot and circle dimensions.
Both the center faceoff spot and center faceoff circle are blue. The spot is a solid blue circle 12 inches (30 cm) in diameter. Within the spot is a center, a circle 30 feet (9.1 m) in diameter, painted with a blue line 2 inches (5.1 cm) in width.
All of the other faceoff spots have outlines 2 inches (5.1 cm) thick, forming a circle 2 feet (0.61 m) in diameter measured from the outsides of the outlines, and are filled in with red in all areas except for the 3 inches (7.6 cm) space from the tops and bottoms of the circles, measured from the insides of the outline. ...
Goal posts and nets.
At each end of the ice, there is a goal consisting of a metal goal frame and cloth net in which each team must place the puck to earn points. According to NHL and IIHF rules, the entire puck must cross the entire goal line in order to be counted as a goal. ...
Goal area.
The crease is a special area of the ice designed to allow the goaltender to perform without interference. In most leagues, goals are disallowed if an attacking player enters the goal crease with a stick, skate, or any body part before the puck. For the purposes of this rule, the crease extends vertically from the painted lines to the top of the goal frame. ...
Goaltender trapezoid.
During the 2004-05 American Hockey League (AHL) season, an experimental rule was implemented for the first seven weeks of the season, instituting a goaltender trap zone, more commonly called the trapezoid in reference to its shape. Under the rule, it is prohibited for the goaltender to handle the puck anywhere behind the goal line that is not within the trapezoidal area. If they do so they are assessed a minor penalty for delay of game. ...
Referee's crease.
The referee's crease is a semicircle ten feet in radius in front of the scorekeepers bench." [Ice hockey rink. Wikipedia]
The diagram template "Ice hockey rink view from long side" for the ConceptDraw PRO diagramming and vector drawing software is included in the Hockey solution from the Sport area of ConceptDraw Solution Park.
Ice hockey rink diagram template
- Free Body Diagram Drawing Software
- Online Free Body Diagram Creator
- Free Body Diagram Download
- Free- body diagram | How to Draw Physics Diagrams in ...
- Physics Diagrams | Free- body diagram | Functional Flow Block ...
- Physics | Ice Hockey Offside Diagram | Free Body Diagram Concept
- Free- body diagram
- Free- body diagram | Physics | How to Draw Physics Diagrams in ...
- Physics | Fishbone Diagram | Rapid UML | Free Body Diagram ...
- Network Diagram Examples | Rack Diagrams | Free- body diagram ...
- Free- body diagram | Mechanics - Vector stencils library | Physics ...
- Physical Sciences Physics P1 Drawing Free Body Diagram
- Physics | Physics Diagrams | How to Draw Physics Diagrams | What ...
- Free Body Diagram Software
- Physics Diagrams | How to Draw Physics Diagrams in ConceptDraw ...
- Free Body Diagram Physics Software Download
- Physics Diagrams | Physics | How to Draw Physics Diagrams | Free ...
- How to Draw Physics Diagrams in ConceptDraw PRO | Physics ...
- How To Draw A Free Body Diagram In Microsoft Word