HelpDesk
How to Draw a Divided Bar Chart

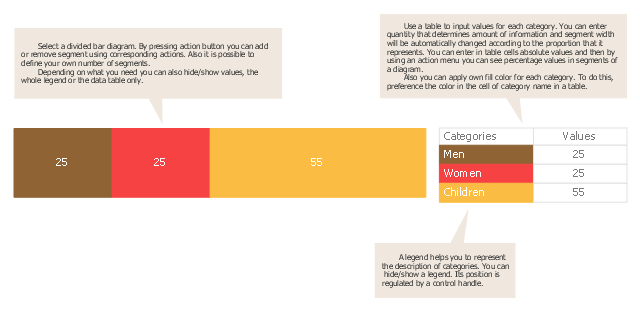
Use this chart template to design your divided bar diagrams.
A divided bar chart is a rectangle divided into segments, illustrating numerical proportion. In a divided bar chart, the length of each segment (and consequently its area), is proportional to the quantity it represents.
This divided bar graph displays the number of people per day who visited swimming pool.
The template "Divided bar diagram" for the ConceptDraw PRO diagramming and vector drawing software is included in the Divided Bar Diagrams solution from the Graphs and Charts area of ConceptDraw Solution Park.
Template
Line Graph

 Divided Bar Diagrams
The Divided Bar Diagrams Solution extends the capabilities of ConceptDraw DIAGRAM with templates, samples, and a library of vector stencils for drawing high impact and professional Divided Bar Diagrams and Graphs, Bar Diagram Math, and Stacked Graph.
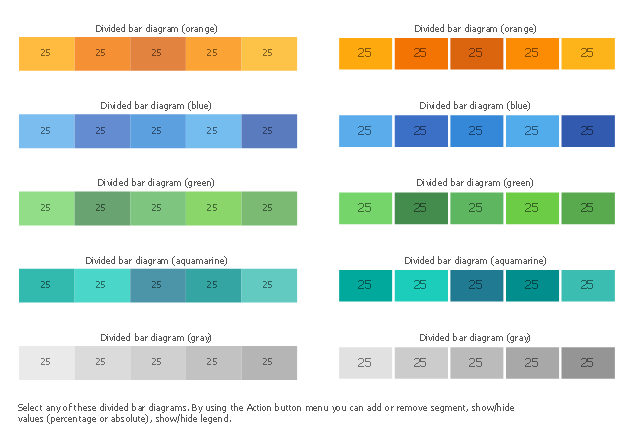
The vector stencils library "Divided bar diagrams" contains 10 chart templates. Use it to draw your divided bar charts in the ConceptDraw PRO diagramming and vector drawing software.
A divided bar graph is a horizontal bar divided into segments to illustrate numerical proportion. Each segment length represents the percentage of the part in the 100% total amount.
The chart templates example "Design elements - Divided bar diagrams"
is included in the Basic Divided Bar Diagrams solution from the Graphs and Charts area of ConceptDraw Solution Park.
Chart templates
 Basic Divided Bar Diagrams
This solution extends the capabilities of ConceptDraw DIAGRAM with templates, samples and a library of vector stencils for drawing Divided Bar diagrams.
 Line Graphs
How to draw a Line Graph with ease? The Line Graphs solution extends the capabilities of ConceptDraw DIAGRAM with professionally designed templates, samples, and a library of vector stencils for drawing perfect Line Graphs.
 Basic Line Graphs
This solution extends the capabilities of ConceptDraw DIAGRAM (or later) with templates, samples and a library of vector stencils for drawing Line Graphs.
Competitor Analysis

Line Chart Examples

Pyramid Diagram and Pyramid Chart

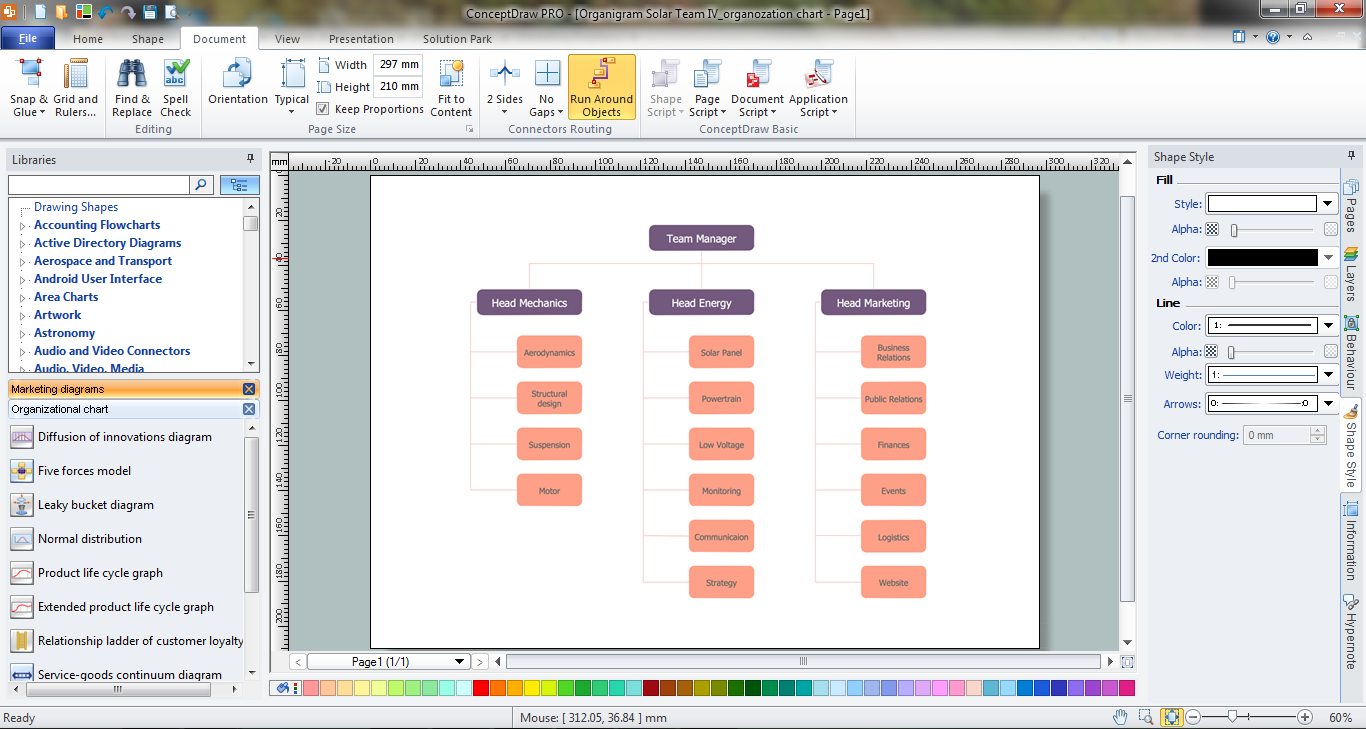
Marketing Organization Chart
How to Draw EPC Diagram Quickly

An EPC diagram is a complex flowchart that shows different business processes through various workflows. The workflows are seen as functions and events that are connected by different teams or people, as well as tasks that allow business processes to be executed.
ConceptDraw DIAGRAM is a software for making EPC diagrams that allows managers visually present business process models for making decisions for business.

Pie Chart Examples and Templates

Pie chart examples and templates created using ConceptDraw DIAGRAM software helps you get closer with pie charts and find pie chart examples suite your needs.
Examples of Flowcharts, Org Charts and More


- Diagramatic Of Divided Bar Graph
- Divided Bar Diagrams | How to Draw a Divided Bar Chart in ...
- Design elements - IDEF0 | Bar Graphs | Tree Diagram Index
- Bar Graph Template
- Bar Graphs
- Divided bar diagram - Template
- Drawing A Divided Bar Graph
- Sales Growth. Bar Graphs Example
- Design elements - Picture bar graphs | Design elements - Scatter ...
- Divided Bar Diagrams
- Divided Bar Diagrams Solution
- How to Draw a Divided Bar Chart in ConceptDraw PRO | Divided ...
- Bar Graphs | Bar Chart Software | How to Create a Bar Chart in ...
- Divided Bar Diagrams
- Divided Bar Graph Examples
- Bar Graphs | Bar Graph | Chart Templates | Percentage Bar ...
- Divided Bar Graphs
- Make Bar Graphs
- Rainfall Bar Chart | Pie Graph Worksheets | Bar Diagrams for ...
- Divided bar graph
- ERD | Entity Relationship Diagrams, ERD Software for Mac and Win
- Flowchart | Basic Flowchart Symbols and Meaning
- Flowchart | Flowchart Design - Symbols, Shapes, Stencils and Icons
- Flowchart | Flow Chart Symbols
- Electrical | Electrical Drawing - Wiring and Circuits Schematics
- Flowchart | Common Flowchart Symbols
- Flowchart | Common Flowchart Symbols