Technical Flow Chart Example
Technical flow chart is a diagrammatic representation that visually illustrates the sequence of operations, steps, or processes, which should be performed to get the problem's solution. It breaks a complex process down into individual components in order to present it in a simplified view, helps to explain complex logic within a system or business process.
Technical flowcharts are used to show the flow of information or materials or present an algorithm. Being designed using standardized symbols and connectors, technical flow charts make technical workflows easy to understand and simplify the communication of technical specialists. They are part of system planning, help to enhance process efficiency, identify potential bottlenecks and inconsistencies, and troubleshoot. Technical flow charts are an essential tool for many technical and non-technical industries to document, plan, and optimize processes, make decision-making easier, and improve project outcomes. They are used successfully in technical analysis, engineering, programming, debugging, etc.
Types of Technical Flow Charts
Being used in numerous industries, technical flowcharts are incredibly diverse, have unique characteristics, serve a unique purpose, respond to specific requirements, and comprise many types:
- Process Flow Chart
- System Flow Chart
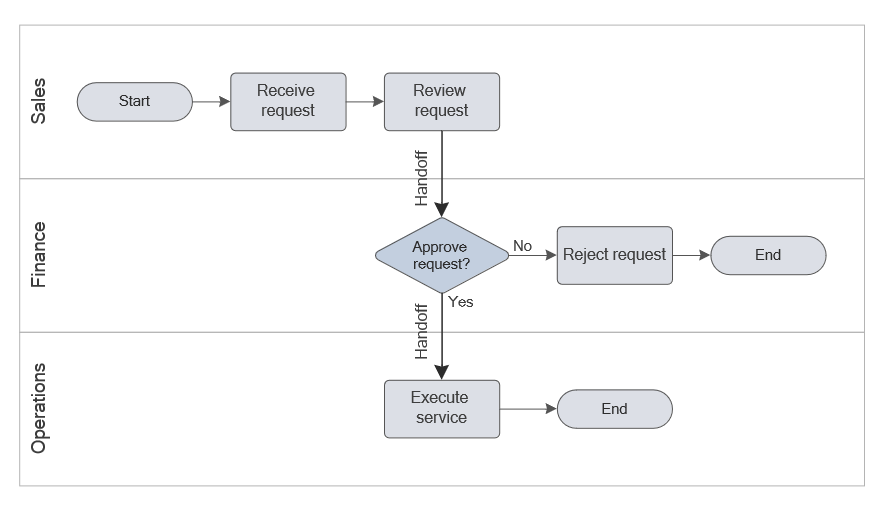
- Swimlane Flow Chart
- Decision Flow Chart
- Cross-Functional Flow Chart
- Block Flow Diagram (BFD)
- Data Flow Diagram (DFD)
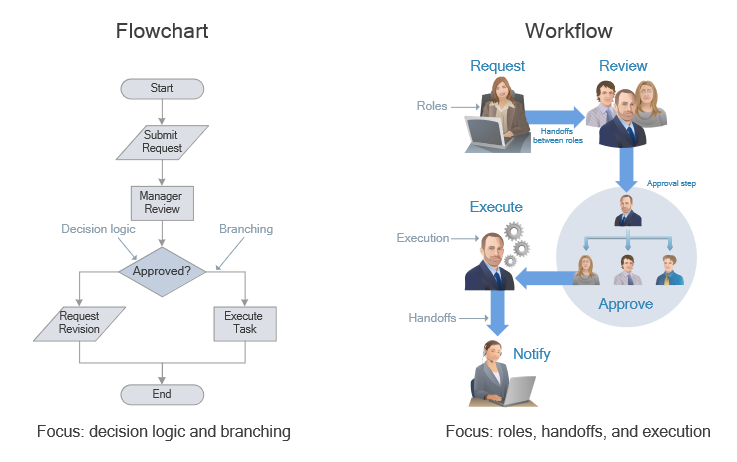
- Workflow Diagram
- Activity Diagram
- Event-Driven Process Chain (EPC)
- Value Stream Mapping (VSM)

Example 1. Design Sample of Flow Chart in ConceptDraw DIAGRAM
Key Components of a Technical Flow Chart
Technical flowcharts include some typical components, which help to illustrate processes, systems, and workflows completely and clearly. The specialized symbols (rectangles, ovals, diamonds, and others) are provided for flow components, which are then connected with arrows to illustrate the sequence and direction of the flow. Being connected, the tech process flow components provide a complete visual overview of the technical processes for further analysis, communication, and improvement.
Start and end symbols are usually ovals or rounded rectangles and represent the beginning and the end of the flow.
Process steps are shown by rectangles and depict individual tasks or actions within the process.
Decision points are represented by diamonds in stages where a decision should be made.
Input and output show the points of data entry or data removal and are designated by parallelograms.
Arrows and connectors connect different parts of the flow chart, indicate the flow of the process, and show the sequence and flow direction.
Importance and Benefits of Technical Flow Charts
Technical flowcharts are vital tools in numerous fields due to the wide range of benefits they provide. They help to document processes, standardize, and maintain consistency in operations.
Technical flow charts:
easier the understanding of complex processes through breaking them down into manageable steps;
guarantee that everyone understands the sequence of operations and his role;
help to identify different types of inefficiencies, bottlenecks, redundancies, and areas for improvement;
help to troubleshoot, analyze, improve, and optimize processes;
enhance problem-solving;
easier communication and coordination among team members and other stakeholders;
contribute to better planning and organization of tasks;
streamline and increase the efficiency of workflows;
are efficient when used as a training and educational tool.
Steps to Create a Technical Flow Chart
Technical flow charts are created using the specialized generally expected symbols for the components. To create a technical flowchart, follow the simple steps:
- Define the purpose, scope, and objective of the flow chart.
- Identify the process or system that you want to present.
- Collect information about the process, its inputs and outputs, tasks, decision points, and other important details.
- Identify the start and end points using the standardized oval symbols.
- Identify key steps involved in the process using rectangular symbols and arrange them in a logical sequence.
- Show inputs and outputs in the sequence.
- Add decisions using diamond symbols and make sure that all possible paths are shown.
- Connect the elements using arrows to clearly indicate the flow direction.
When your flow chart is ready, you can share it with team members and other stakeholders to review, communicate, check for completeness, analyze and optimize it, if needed. If necessary, you can always make required adjustments, and simplify the chart to enhance its readability and efficiency. Keep your flow chart accurate and always relevant, and maintain it after any changes in processes. Update it timely as well to ensure your flow chart reflect accurately the current process.
Moreover, strive to keep your flow chart simple without unnecessary complexity to ensure simplicity of understanding. Manage the number of steps, the ideal number that helps to avoid users' overwhelming is under 20. More complex processes can be broken down into smaller sub-processes. It is recommended to fit the whole flowchart on one page, however, a multi-page view is also acceptable. You can increase or reduce the scale of your flowchart if needed.
Maintain logical flow and ensure consistency, avoid vague or ambiguous terms and keep the same size of the shapes and spacing between them. Use color coding and highlight critical steps or important decision points to help stakeholders to identify the most important points or parts of the process quickly.
Add a legend to explain used symbols, colors, and abbreviations to ensure correct interpretation of the chart for all users.
Benefits of ConceptDraw DIAGRAM for Technical Flow Chart Design
ConceptDraw DIAGRAM software enhanced with Flowcharts solution from the Diagrams area of ConceptDraw Solution Park is a perfect software for drawing clear and efficient tech flow charts illustrating the essence and importance of the technical flow diagram use.

Example 2. Technical Flow Chart Solution
Thanks to the powerful drawing tools of Flowcharts solution the technical flow chart can be drawn in mere minutes. You need only apply ready-to-use vector objects from the Flowchart and Flowcharts Rapid Draw libraries of Flowcharts solution, or use the predesigned template.

Example 3. Technical Flow Chart Example and Template (Macintosh® and Windows®)
Use the Flowcharts Solution for ConceptDraw DIAGRAM flowchart software to create your own detailed technical process flow diagram and represent flow processes quickly, easily, and effectively.

Example 4. Example of Flow Chart Diagram
Examples
The process flow diagram examples you see on this page are part of the Flowcharts solution for ConceptDraw DIAGRAM flowchart application. These are the technical flow examples representing processes, systems, and workflows for different industries. Technical process flow charts are useful in manufacturing and construction industries, IT, healthcare and pharmaceutical industry, logistics and supply chains, retail industry, financial services, telecommunications, education, and many more.
All source documents are vector graphic documents available from the ConceptDraw STORE. They are suitable for reviewing, modifying, or converting to a variety of formats (PDF, MS PowerPoint, MS Visio, and many other graphic formats). The Flowcharts solution is available for all ConceptDraw DIAGRAM users.
Conclusion
Technical flowchart is a perfect tool to document processes, illustrate the steps in a production process, from the purchase of raw materials to delivery of the end product, and track data flow through a process. They are helpful for engineers, business users, IT developers, project managers, and other specialists from various fields.
The powerful ConceptDraw DIAGRAM software is the perfect tool for designing flow charts in varied fields, such as IT, manufacturing, construction, healthcare, pharmaceutical, financial services, retail industry, education, logistics and supply chain, telecommunications, and many others.
Effective technical flowcharts are designed using the standardized technical flowchart symbols and according to the unified requirements to ensure clarity, accuracy, and usability. They are a valuable tool for communicating, analyzing and improving processes, identifying bottlenecks, troubleshooting, improving efficiency and optimizing processes.