SysML
ConceptDraw DIAGRAM diagramming and vector drawing software was developed for the purpose of helping the systems engineers as well as the other ConceptDraw DIAGRAM users design the various model systems with SysML, which is the Systems Modelling Language – the modelling language, used especially for the systems engineering applications. This language supports the analysis, the specification, the design, validation as well as verification of the different systems as well as the systems-of-systems. This SysML was originally defined as an extension of a subset of the UML, which is well known as “Unified Modelling Language”, using the UML’s profile mechanism. The Systems Modelling Language allows the systems engineers to use the several noteworthy improvements over UML, including the SysML's semantics. The Systems Modelling Language reduces the UML's software-centric restrictions and it adds two new diagram types, which are the requirement and the parametric diagrams. SysML can model lots of different systems, including the hardware, information, software, processes, facilities and personnel.
This language is a comparatively little, which makes it easier to learn and so to apply it. SysML reuses seven of UML 2's fourteen diagrams, and also it adds two more diagrams, which were already mentioned – the requirement and the parametric ones. The Systems Modelling Language also supports the allocation tables. Among the other advantages of SysML over UML for systems engineers’ use we can mention that with SysML everyone can use those so-called the “requirement diagrams” in order to capture the performance, interface and functional requirements, whereas with UML there are limitations of the use case diagrams in order to define the high-level functional requirements.
The parametric diagrams can be used within SysML for defining the performance and the quantitative constrains. There is no straightforward mechanism for capturing this sort of the essential performance as well as the quantitative information. Taking into consideration the rest of the automotive system, the so-called “state machine” as well as the activity diagrams can be both used for specifying the embedded software control logic and, of course, the information flows for the automotive computers.
You can always use the behavioural as well as the structural diagrams for modelling the factories, which are meant to build the automobiles as well as the interfaces between the organizations. Despite the fact that this language is known to be quite simple, it still takes time and effort to learn it. The Systems Modelling Language is known to be a conventional language for conducting the so-called model-based systems engineering. Nevertheless, it has some very important limitations which reduce its efficiency and so its acceptance. Thus, the Systems Modelling Language is known to be a so-called “hermetic” one, which can be quite difficult for some of its users.
In general, there are all together nine types of diagrams within SysML as an extension of UML, which are “Activity”, “Block Definition”, “Internal Block” diagram, “Package” one, “Parametric” one, “Requirement”, “Sequence”, “State Machine” as well as “Use Case” one. Some of them can be built in a way of the extending the intended use of block definition diagrams. Although the results are not always adequate and they often are not in concordance with the rules of the “SysML language: themselves. The missing elements may include the “House of Quality”, “N2 chart”, the “functional block diagram”, the “Ishikawa diagram”, also known as a “fishbone” one, “parameter diagram”, etc. This language is improving non-stop and so the other diagram types can appear in the future updates.
In general, as it is a well-known fact, the diagrams are generated by “SysML” are all complicated and some of them are even very difficult to understand by people, who are not very familiar with the language. Some of the elements are slightly counter-intuitive, which can lead to both errors and confusion. The diagrams, created within the system by engineers are known to be accessed by those, who consider themselves as the system engineers, as all of the other users are unlikely to know “SysML” well enough to use it on the everyday basis. This, though, can be an overcome by including the explanatory notes as well as legends in the final “SysML diagrams” in order to simplify their interpretation.
The diagrams created in accordance with the rules of “SysML” often include the redundant pieces of all of the model information, impairing their interpretation. There are a few modelling tool vendors offering the SysML support. There are also some in the process of updating their tools to comply with the OMG SysML specification and the lists of the tool vendors which support SysML (or “OMG SysML”) can be found on the “SysML Forum” as well as the SysML websites.
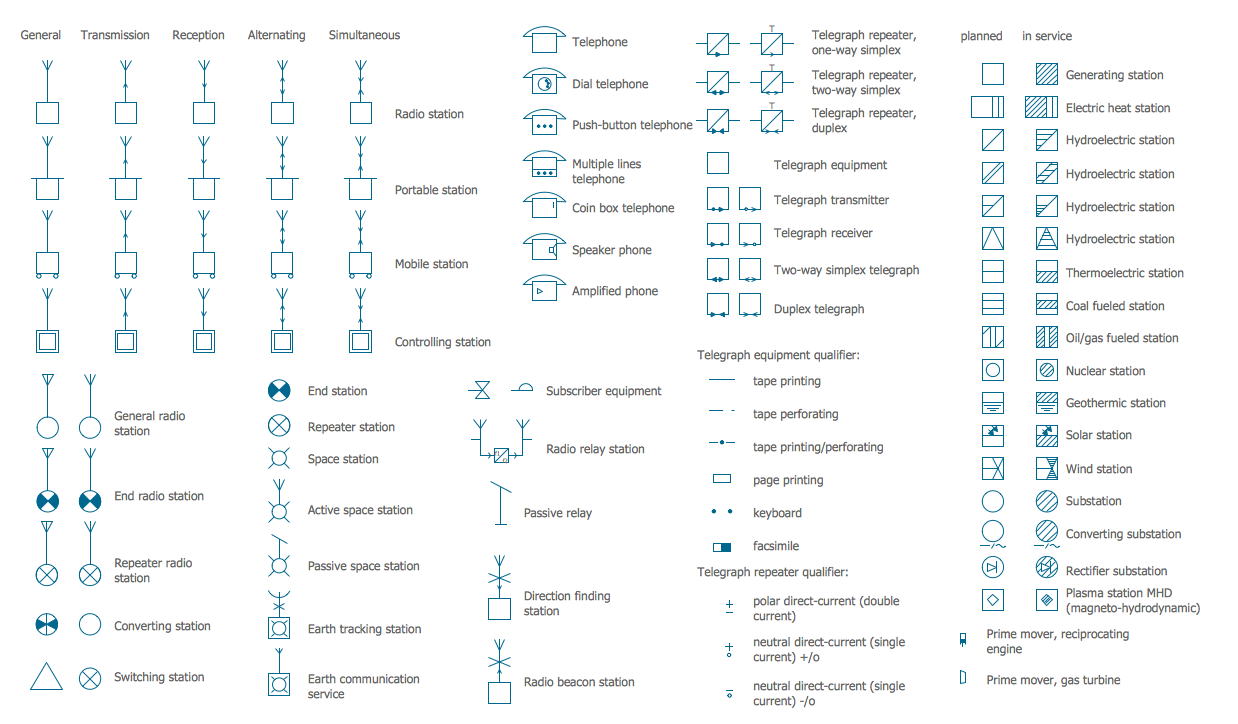
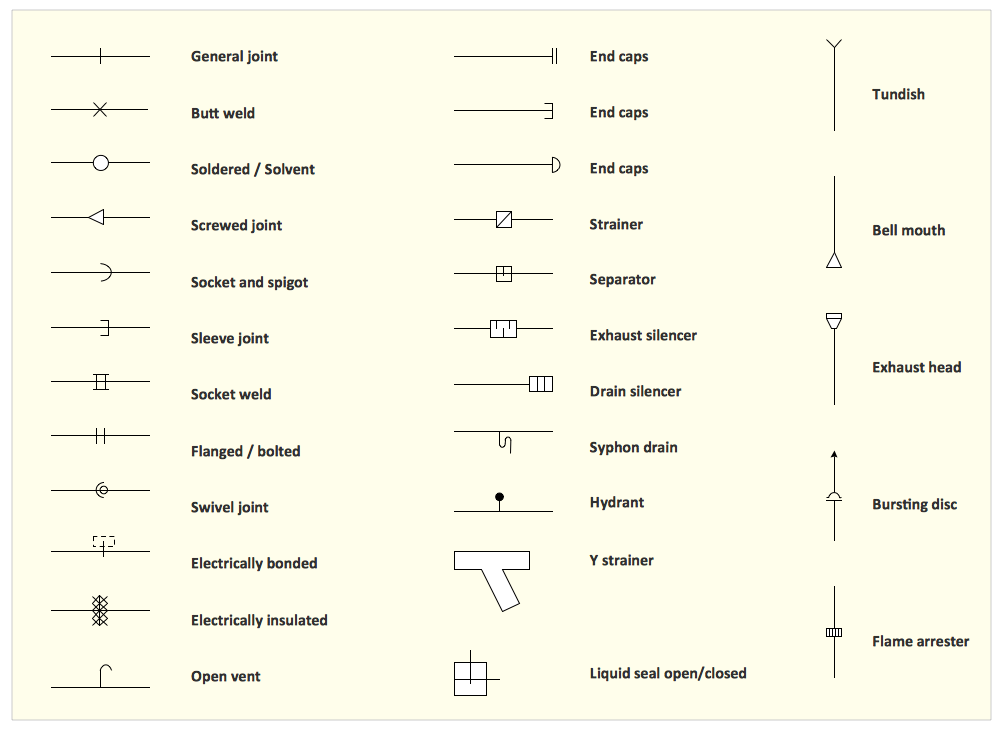
SysML Solution developed by the CS Odessa team especially for the ConceptDraw DIAGRAM users provides 13 libraries, including all of the needed pre-designed vector objects and icons for allowing those users to draw the diagrams of any of the mentioned 9 official types used within SysML. All of the 13 libraries contain all together 284 design objects and all of those objects are vector ones, so they can be always resized without loss of quality, if needed. Designing any of the mentioned “SysML diagrams”, you can simply create a new ConceptDraw document, choose the desired objects from the available stencil libraries and simply drag them to the needed places within your ConceptDraw DIAGRAM document.

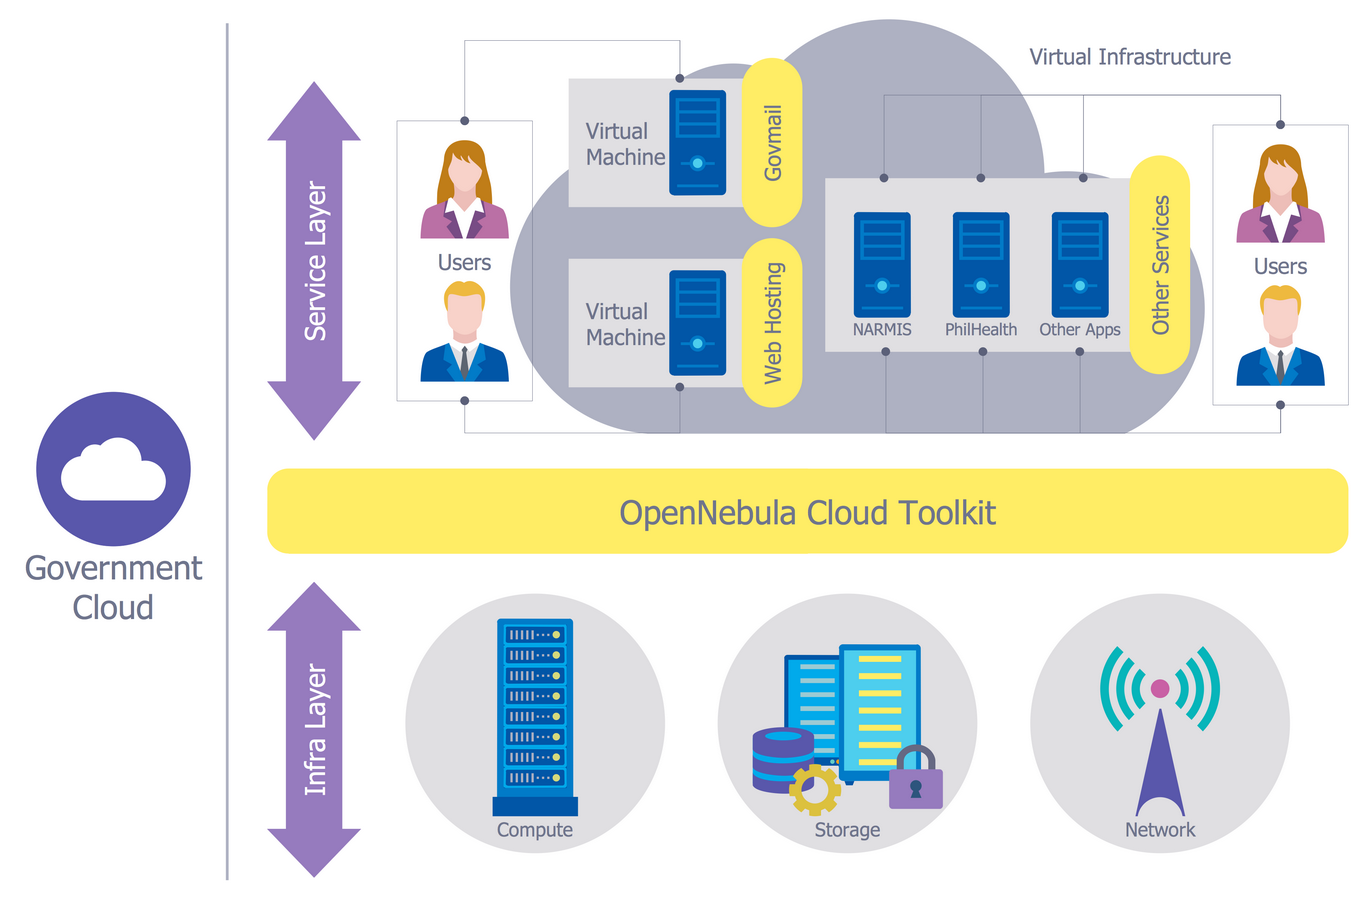
Example 1. SysML Solution
The “SysML solution” also offers a large collection of previously designed professional SysML diagrams. Each of them can be a very good example and so it can become a perfect base for your own SysML diagram as well as system model. The samples you can see on this site all were created using the ConceptDraw DIAGRAM software with the tools from the Solutions from the ConceptDraw DIAGRAM Solution Park or from ConceptDraw STORE application, which is another very useful product of CS Odessa.

Example 2. SysML Parametric Diagram
SysML is an extension of UML which uses 9 types of diagrams:
- Activity diagram
- Block Definition diagram
- Internal Block diagram
- Package diagram
- Parametric diagram
- Requirement diagram
- Sequence diagram
- State Machine diagram
- Use Case diagram
SysML Solution for ConceptDraw DIAGRAM provides 13 libraries including all needed predesigned vector objects and icons for drawing diagrams of any of these 9 official types used in SysML.


These 13 libraries contains 284 objects, all they are vector and can be easy resized without loss of quality. For designing a SysML diagram, create new ConceptDraw document, choose desired objects from this diversity and simply drag on the needed places in document.

Example 3. SysML Block Definition Diagram
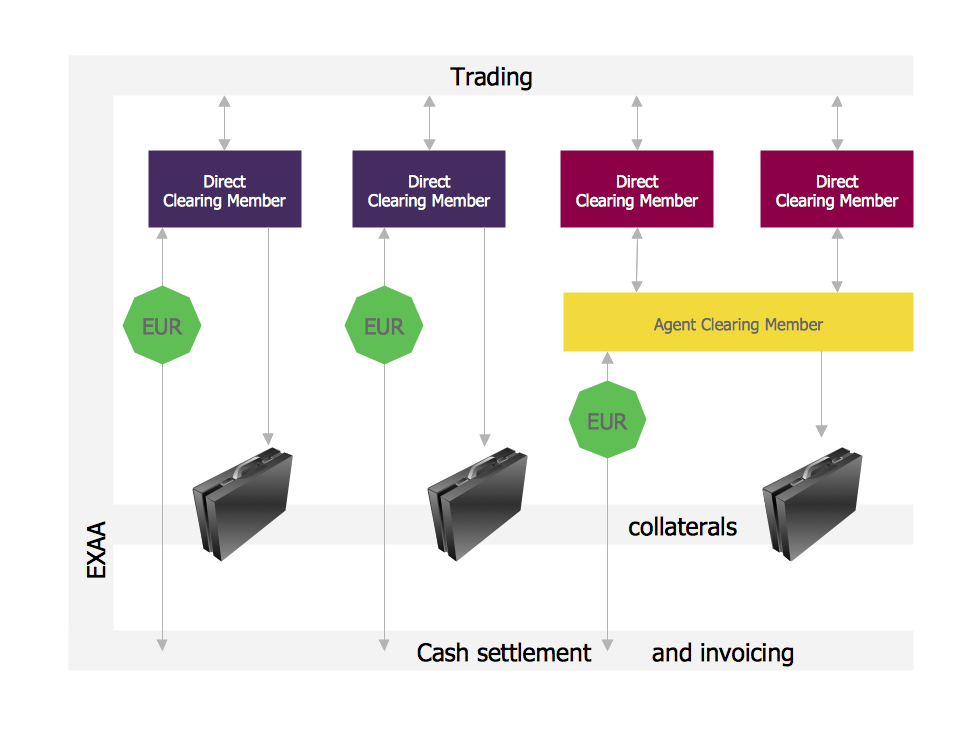
SysML solution offers also large collection of professionally designed SysML diagrams. Each of them is a good example and can become a perfect base for your own SysML diagram or system model.

Example 4. SysML Identity Requirements Diagram
The samples you see on this page were created in ConceptDraw DIAGRAM software using the tools of SysML Solution for ConceptDraw DIAGRAM Solution Park. These SysML diagrams successfully demonstrate solution's capabilities and professional results you can achieve. An experienced user spent 20-25 minutes creating each of these samples.
Use the systems engineering tools of SysML Solution for ConceptDraw DIAGRAM for creating systems models and designing SysML diagrams of any complexity quick, easy and effective.
All source documents are vector graphic documents. They are available for reviewing, modifying, or converting to a variety of formats (PDF file, MS PowerPoint, MS Visio, and many other graphic formats) from the ConceptDraw STORE. The SysML Solution is available for all ConceptDraw DIAGRAM users.