HelpDesk
How to Draw an Area Chart in ConceptDraw PRO

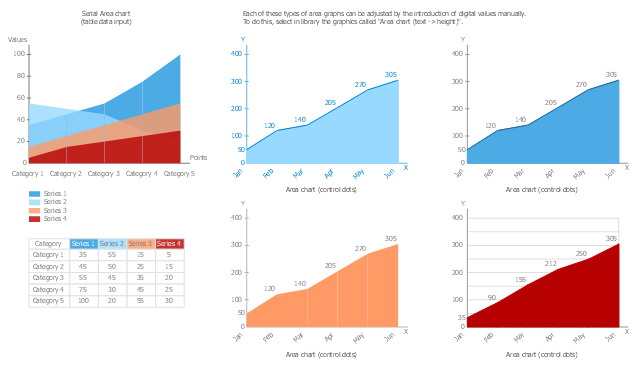
Area Chart

The vector stencils library Area Charts contains 8 templates to draw area graphs using the ConceptDraw PRO diagramming and vector drawing software .
"An area chart or area graph displays graphically quantitive data. It is based on the line chart. The area between axis and line are commonly emphasized with colors, textures and hatchings. ...
Area charts are used to represent cumulated totals using numbers or percentages (stacked area charts in this case) over time. Use the area chart for showing trends over time among related attributes." [Area chart. Wikipedia]
The area chart example "Design elements - Area charts" is included in the Area Charts solution from the Graphs and Charts area of ConceptDraw Solution Park.
Area graphs
 Area Charts
Area Charts are used to display the cumulative totals over time using numbers or percentages; or to show trends over time among related attributes. The Area Chart is effective when comparing two or more quantities. Each series of data is typically represented with a different color, the use of color transparency in an object’s transparency shows overlapped areas and smaller areas hidden behind larger areas.
The vector stencils library "Area charts" contains 8 area chart templates you can drag into your document and set data by numbers entering or moving control dots. Use these templates to draw your area graphs in the ConceptDraw PRO diagramming and vector drawing software extended with the Area Charts solution from the Graphs and Charts area of ConceptDraw Solution Park.
Area chart (control dots)
-area-charts---vector-stencils-library.png--diagram-flowchart-example.png)
Area chart (text -> height)
-area-charts---vector-stencils-library.png--diagram-flowchart-example.png)
Area chart (control dots)
-area-charts---vector-stencils-library.png--diagram-flowchart-example.png)
Area chart (text -> height)
-area-charts---vector-stencils-library.png--diagram-flowchart-example.png)
Area chart (control dots)
-area-charts---vector-stencils-library.png--diagram-flowchart-example.png)
Area chart (text -> height)
-area-charts---vector-stencils-library.png--diagram-flowchart-example.png)
Area chart (control dots)
-area-charts---vector-stencils-library.png--diagram-flowchart-example.png)
Area chart (text -> height)
-area-charts---vector-stencils-library.png--diagram-flowchart-example.png)
Chart Software for Better Presentations

Graphs and Charts Area provide a wide collection of professional looking predesigned templates, samples and ready-to-use vector stencils that will help you to draw the charts and diagrams of various types: Pie Charts, Donut Charts, Line Charts, Column Charts, Bar Charts, Pyramids, Scatter Charts, Venn Diagrams, Spider Charts, Area Charts, Divided Bar Graphs.
How to Create Presentation of Your Project Gantt Chart

Sales Growth. Bar Graphs Example

Donut Chart

Histogram Chart

Basic Diagramming


Bar Chart

Organization Chart Templates

What Is a Line Chart

Bar Charts

- Area Charts
- Area chart template | Line Chart Template for Word | Donut Chart ...
- Step Area Graph | US incarceration timeline-clean - Area graph ...
- How to Draw an Area Chart in ConceptDraw PRO | Area charts ...
- Area Charts | How to Draw an Area Chart in ConceptDraw PRO ...
- Area Charts | Step Area Graph | Graphs and Charts Area | Area ...
- Area chart template
- Area charts - Vector stencils library | Bar charts - Vector stencils ...
- Basic Diagramming | Line Chart Examples | Area Charts ...
- Design elements - Marketing charts | Design elements - Area charts ...
- Area Chart | Step Area Graph | How to Draw a Line Graph | The ...
- Basic Diagramming | Area Chart | Scatter Graph Charting Software ...
- Basic Flowchart Symbols and Meaning | Area Charts | How to Draw ...
- Line graphs - Vector stencils library | Graphs and Charts Area ...
- How to Draw an Area Chart in ConceptDraw PRO | Area Charts ...
- Area Charts | Picture Graphs | Line Graphs | Pictorial Chart Of Over ...
- San Francisco population history - Area chart | San Francisco ...
- Basic Diagramming | Sample Pictorial Chart . Sample Infographics ...
- How to Draw an Area Chart in ConceptDraw PRO | Gant Chart in ...