The vector stencils library "Area charts" contains 9 area chart templates you can drag into your document and set data by numbers entering or moving control dots. Use these templates to draw your area graphs in the ConceptDraw PRO diagramming and vector drawing software.
The vector stencils library "Area charts" is included in the Area Charts solution from the Graphs and Charts area of ConceptDraw Solution Park.
The vector stencils library "Area charts" is included in the Area Charts solution from the Graphs and Charts area of ConceptDraw Solution Park.
Area chart (control dots)
-area-charts---vector-stencils-library.png--diagram-flowchart-example.png)
Area chart (text -> height)
-area-charts---vector-stencils-library.png--diagram-flowchart-example.png)
Area chart (control dots)
-area-charts---vector-stencils-library.png--diagram-flowchart-example.png)
Area chart (text -> height)
-area-charts---vector-stencils-library.png--diagram-flowchart-example.png)
Area chart (control dots)
-area-charts---vector-stencils-library.png--diagram-flowchart-example.png)
Area chart (text -> height)
-area-charts---vector-stencils-library.png--diagram-flowchart-example.png)
Area chart (control dots)
-area-charts---vector-stencils-library.png--diagram-flowchart-example.png)
Area chart (text -> height)
-area-charts---vector-stencils-library.png--diagram-flowchart-example.png)
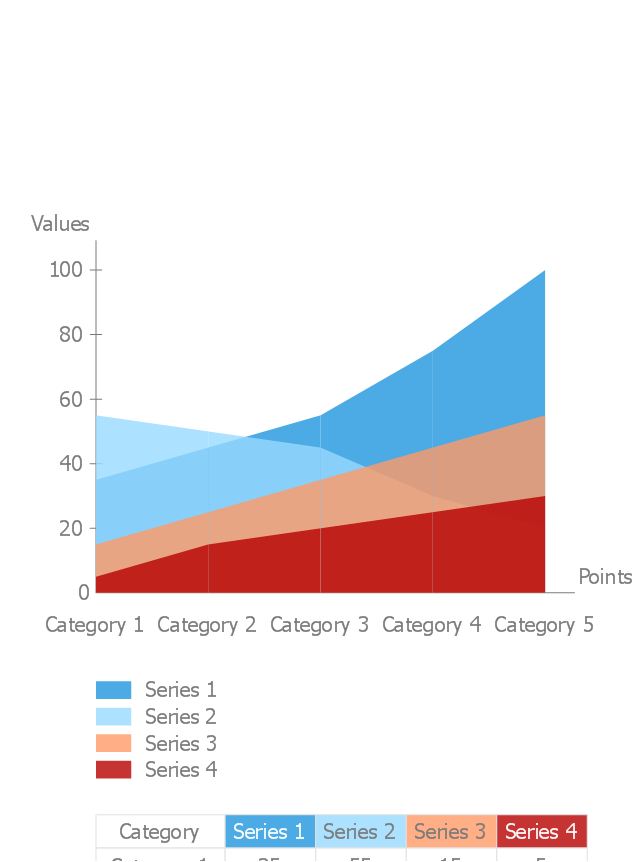
Area chart - serial
 Basic Area Charts
This solution extends the capabilities of ConceptDraw PRO v10.3.0 (or later) with templates, samples and a library of vector stencils for drawing Area Charts (area graphs) that visualize changes in values by filling in the area beneath the line connecting data points.
- How to Draw an Area Chart in ConceptDraw PRO | Area Charts ...
- Area Charts | Area Chart | How to Draw an Area Chart in ...
- Area Graphs
- Area Graph Template
- Basic Diagramming | Area Chart | Create Graphs and Charts ...
- US incarceration timeline-clean - Area graph | Step Area Graph ...
- Line Graph | Line Chart Examples | Area Chart | Bar Graphs Of Over ...
- Step Area Graph | US incarceration timeline-clean - Area graph ...
- Process Flowchart | Area Charts | How to Draw an Area Chart in ...