The vector stencils library Area Charts contains 9 templates to draw area graphs using the ConceptDraw PRO diagramming and vector drawing software .
"An area chart or area graph displays graphically quantitive data. It is based on the line chart. The area between axis and line are commonly emphasized with colors, textures and hatchings. ...
Area charts are used to represent cumulated totals using numbers or percentages (stacked area charts in this case) over time. Use the area chart for showing trends over time among related attributes." [Area chart. Wikipedia]
The area chart example "Design elements - Area charts" is included in the Area Charts solution from the Graphs and Charts area of ConceptDraw Solution Park.
Graph templates
 Area Charts
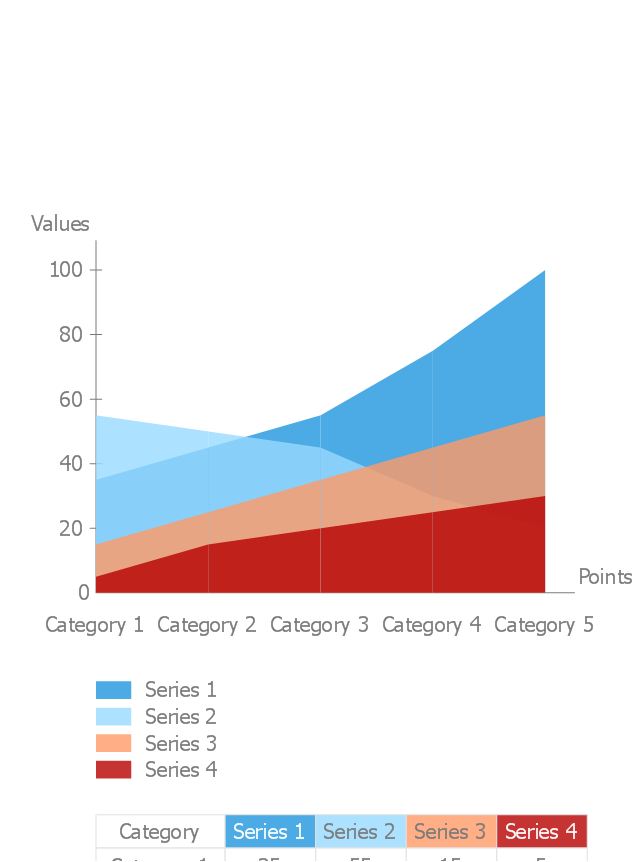
Area Charts are used to display the cumulative totals over time using numbers or percentages; or to show trends over time among related attributes. The Area Chart is effective when comparing two or more quantities. Each series of data is typically represented with a different color, the use of color transparency in an object’s transparency shows overlapped areas and smaller areas hidden behind larger areas.
 Basic Area Charts
This solution extends the capabilities of ConceptDraw PRO v10.3.0 (or later) with templates, samples and a library of vector stencils for drawing Area Charts (area graphs) that visualize changes in values by filling in the area beneath the line connecting data points.
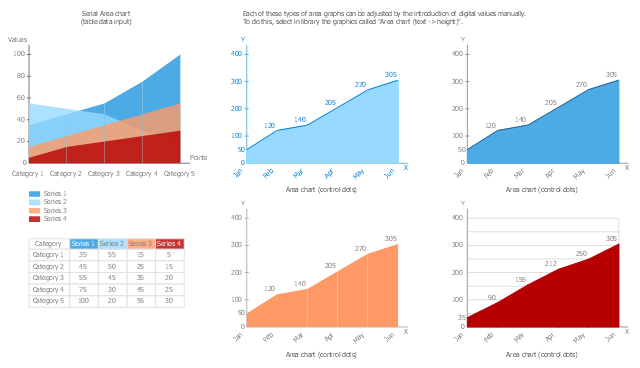
The vector stencils library "Area charts" contains 9 area chart templates you can drag into your document and set data by numbers entering or moving control dots. Use these templates to draw your area graphs in the ConceptDraw PRO diagramming and vector drawing software.
The vector stencils library "Area charts" is included in the Area Charts solution from the Graphs and Charts area of ConceptDraw Solution Park.
The vector stencils library "Area charts" is included in the Area Charts solution from the Graphs and Charts area of ConceptDraw Solution Park.
Area chart (control dots)
-area-charts---vector-stencils-library.png--diagram-flowchart-example.png)
Area chart (text -> height)
-area-charts---vector-stencils-library.png--diagram-flowchart-example.png)
Area chart (control dots)
-area-charts---vector-stencils-library.png--diagram-flowchart-example.png)
Area chart (text -> height)
-area-charts---vector-stencils-library.png--diagram-flowchart-example.png)
Area chart (control dots)
-area-charts---vector-stencils-library.png--diagram-flowchart-example.png)
Area chart (text -> height)
-area-charts---vector-stencils-library.png--diagram-flowchart-example.png)
Area chart (control dots)
-area-charts---vector-stencils-library.png--diagram-flowchart-example.png)
Area chart (text -> height)
-area-charts---vector-stencils-library.png--diagram-flowchart-example.png)
Area chart - serial
Area Charts

HelpDesk
How to Draw an Area Chart in ConceptDraw PRO

Area Chart

The vector stencils library "Area charts" contains 9 area chart templates you can drag into your document and set data by numbers entering or moving control dots. Use these templates to draw your area graphs in the ConceptDraw PRO diagramming and vector drawing software.
The vector stencils library "Area charts" is included in the Area Charts solution from the Graphs and Charts area of ConceptDraw Solution Park.
The vector stencils library "Area charts" is included in the Area Charts solution from the Graphs and Charts area of ConceptDraw Solution Park.
Area chart (control dots)
Area chart (text -> height)
Area chart (control dots)
Area chart (text -> height)
Area chart (control dots)
Area chart (text -> height)
Area chart (control dots)
Area chart (text -> height)
Area chart - serial
This area chart sample shows the US federal prisoner population changes from 1914 to 2010.
"The Federal Bureau of Prisons (BOP) is a United States federal law enforcement agency. A subdivision of the U.S. Department of Justice, the Bureau is responsible for the administration of the federal prison system. The system also handles prisoners who committed acts considered felonies under the District of Columbia's law. The Bureau was established in 1930 to provide more progressive and humane care for federal inmates, to professionalize the prison service, and to ensure consistent and centralized administration of the 11 federal prisons in operation at the time.
According to its official web site, the Bureau consists of more than 116 institutions, six regional offices, its headquarters office in Washington, D.C., two staff training centers, and 22 community corrections offices, and is responsible for the custody and care of approximately 210,000 federal offenders. Approximately 82 percent of these inmates are confined in Bureau-operated correctional facilities or detention centers. The remainder are confined through agreements with state and local governments or through contracts with privately operated community corrections centers, detention centers, prisons, and juvenile facilities." [Federal Bureau of Prisons. Wikipedia]
This area graph sample was redesigned from the Wikimedia Commons file: Federal timeline US prisoners.gif. [commons.wikimedia.org/ wiki/ File:Federal_ timeline_ US_ prisoners.gif]
The area chart example "Federal timeline US prisoners" was created using the ConceptDraw PRO diagramming and vector drawing software extended with the Area Charts solution from the Graphs and Charts area of ConceptDraw Solution Park.
Area graph

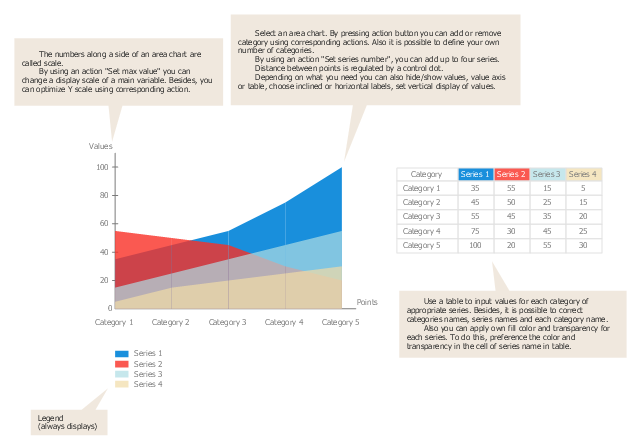
Use this template to design your area graphs.
"An area chart or area graph displays graphically quantitive data. It is based on the line chart. The area between axis and line are commonly emphasized with colors, textures and hatchings. Commonly one compares with an area chart two or more quantities.
Area charts are used to represent cumulated totals using numbers or percentages (stacked area charts in this case) over time. Use the area chart for showing trends over time among related attributes. The area chart is like the plot chart except that the area below the plotted line is filled in with color to indicate volume.
When multiple attributes are included, the first attribute is plotted as a line with color fill followed by the second attribute, and so on." [Area chart. Wikipedia]
The template "Area chart" for the ConceptDraw PRO diagramming and vector drawing software is included in the Area Charts solution from the Graphs and Charts area of ConceptDraw Solution Park.
Template
Basic Diagramming


Basic Diagramming


The vector stencils library "Education charts" contains 12 graphs and charts: area chart, column chart, divided bar diagram, histogram, horizontal bar graph, line graph, pie chart, ring chart, scatter plot.
Use it to create your education infogram in the ConceptDraw PRO diagramming and vector drawing software.
The vector stencils library "Education charts" is included in the Education Infographics solution from the Business Infographics area of ConceptDraw Solution Park.
Use it to create your education infogram in the ConceptDraw PRO diagramming and vector drawing software.
The vector stencils library "Education charts" is included in the Education Infographics solution from the Business Infographics area of ConceptDraw Solution Park.
Area chart - serial

Column chart

Column chart - serial

Divided bar diagram

Frequency histogram

Horizontal bar chart

Horizontal bar chart - serial

Line chart - serial

Pie chart

Ring chart

Scatter plot

Scatter plot - serial

Chart Software for Better Presentations

This area chart sample shows the population growth of San Francisco, California from 1850-2005. It was redesigned from the Wikimedia Commons file: San Francisco CA Population Growth.svg. [commons.wikimedia.org/ wiki/ File:San_ Francisco_ CA_ Population_ Growth.svg]
"The San Francisco Bay Area, commonly known as the Bay Area, is a populated region that surrounds the San Francisco and San Pablo estuaries in Northern California, United States. The region encompasses the major cities and metropolitan areas of San Francisco, Oakland, and San Jose, along with smaller urban and rural areas. The Bay Area's nine counties are Alameda, Contra Costa, Marin, Napa, San Francisco, San Mateo, Santa Clara, Solano, and Sonoma. Home to approximately 7.44 million people, the nine-county Bay Area contains many cities, towns, airports, and associated regional, state, and national parks, connected by a network of roads, highways, railroads, bridges, tunnels and commuter rail. The combined urban area of San Francisco and San Jose is the second largest in California (after the Greater Los Angeles area), the fifth largest in the United States, and the 56th largest urban area in the world." [San Francisco Bay Area. Wikipedia]
The area graph example "San Francisco CA Population Growth" was created using the ConceptDraw PRO diagramming and vector drawing software extended with the Area Charts solution from the Graphs and Charts area of ConceptDraw Solution Park.
Area chart

- Area chart - Template | Line Chart Template for Word | Pie Chart ...
- Area charts - Vector stencils library
- Area charts - Vector stencils library
- How to Draw an Area Chart in ConceptDraw PRO | Area Charts ...
- Area charts - Vector stencils library | How to Draw an Area Chart in ...
- Step Area Graph | How to Draw a Line Graph | Area Chart | The ...
- Area chart template
- Area Charts | Step Area Graph | Graphs and Charts Area | Area ...
- Area charts - Vector stencils library | Bar charts - Vector stencils ...
- Area Charts | How to Draw an Area Chart in ConceptDraw PRO ...
- Basic Flowchart Symbols and Meaning | Area Charts | How to Draw ...
- San Francisco population history - Area chart | Geo Map - USA ...
- Basic Diagramming | Line Chart Examples | Area Charts ...
- Design elements - Marketing charts | Design elements - Area charts ...
- Computer Network Diagrams | Area Charts | Cisco Network ...
- Area Charts | Picture Graphs | Flowchart Examples and Templates ...
- How to Make a Timeline | Area Charts | Project Timeline | How To ...
- Area Charts | Audio, Video, Media | Metro Map | How To Draw A ...
- Area Charts | Circle-Spoke Diagrams | Picture Graphs | Population ...