Made with
ConceptDraw
DIAGRAM 17

Area Charts

ConceptDraw DIAGRAM diagramming and vector drawing software extended with Area Charts solution from the Graphs and Charts area of ConceptDraw Solution Park is the best for drawing the Area Charts simply and fast.

Area Charts *

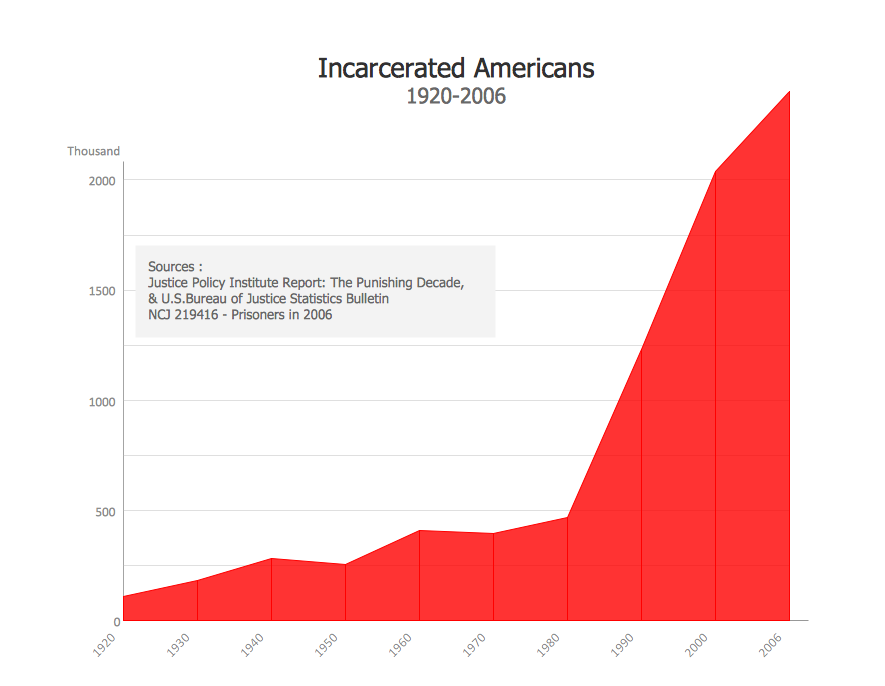
Example 1. Area Charts - US Incarceration Timeline Clean

Area Charts are quite popular and excellently visualize changes in values by filling in the area beneath the line connecting data points.

Area Charts - San Francisco CA Population Growth

Example 2. Area Charts - San Francisco CA Population Growth

Use the Area Charts Solution from the Graphs and Charts area with wide variety of predesigned templates and samples, library of ready-to-use vector objects to design the professional looking Area Charts in minutes. It's impossible to describe in words, how is it convenient to use the predesigned objects, because in this case all that you need is to choose the desired, drag it from the Area Charts library to the document and set your values.

Area Charts - Federal Timeline US Prisoners

Example 3. Area Charts - Federal Timeline US Prisoners

The samples you see on this page were created in ConceptDraw DIAGRAM using the tools of Area Charts Solution from the Graphs and Charts area. These samples demonstrate the solution's capabilities and the professional results you can achieve. An experienced user spent 5 minutes creating every of these samples.

Use Area Charts Solution for ConceptDraw DIAGRAM to draw your own Area Charts quick, easy, and effective.

All source documents are vector graphic documents. They are available for reviewing, modifying, or converting to a variety of formats (PDF file, MS PowerPoint, MS Visio, and many other graphic formats) from the ConceptDraw STORE. The Area Charts Solution is available for all ConceptDraw DIAGRAM or later users.


THREE RELATED HOW TO's:
To design line and scatter charts use ConceptDraw DIAGRAM diagramming and vector drawing software extended with Line Graphs solution from Graphs and Charts area of ConceptDraw DIAGRAM Solution Park. (Line chart, scatter chart, 2d chart).Line Graph Charting Software *
Picture: Line Graph Charting Software
Related Solution:
There are numerous articles about the advantages of flowcharting, creating business graphics and developing different charts. Nevertheless, these articles are almost useless without the main component - the examples of flowcharts, org charts and without a fine example, it is difficult to get all the conveniences of creating diagrams. You can find tons of templates and vivid examples on Solution Park. This illustration shows a variety of business diagrams that can be created using ConceptDraw DIAGRAM. It comprises a different fields of business activities: management, marketing, networking, software and database development along with design of infographics and business illustrations. ConceptDraw DIAGRAM provides a huge set of sample drawings including business process modeling diagrams,, network diagrams, UML diagrams, orgcharts, DFD, flowcharts, ERD, geographical maps and more.Examples of Flowcharts, Org Charts and More *
Picture: Examples of Flowcharts, Org Charts and More
Related Solution:
What Is a Wireless Network? Wireless network refers to any type of computer network that uses wireless (usually, but not always radio waves) for network connections. Wireless computer network diagrams help system administrators and network engineers to find out amount and type of equipment needed for each office WLAN.What Is a Wireless Network? *
Picture: What Is a Wireless Network?
Related Solution:
ConceptDraw
DIAGRAM 17