Opportunity Flowcharts visualize business processes with decision steps and check points. They are used to improve the business processes by displaying possible process directions and identification of steps that add cost but not value.
The opportunity flowchart template for the ConceptDraw PRO diagramming and vector drawing software is included in the Cross-Functional Flowcharts solution from the Business Processes area of ConceptDraw Solution Park.
The opportunity flowchart template for the ConceptDraw PRO diagramming and vector drawing software is included in the Cross-Functional Flowcharts solution from the Business Processes area of ConceptDraw Solution Park.
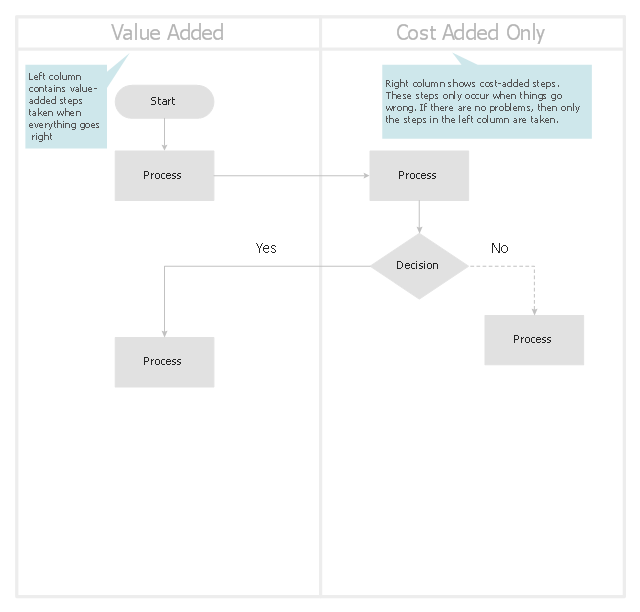
Opportunity flowchart template
"Business process improvement (BPI) is a systematic approach to help an organization optimize its underlying processes to achieve more efficient results. ...
An organization is only as good as its processes. To be able to make the necessary changes in an organization, one needs to understand the key processes of the company. Rummler and Brache suggested a model for running a Process Improvement and Management project (PI&M), containing the following steps:
1. Identify the process to be improved (based on a critical business issue): The identification of key processes can be a formal or informal exercise. The management team might select processes by applying a set of criteria derived from strategic and tactical priorities, or process selection is based on obvious performance gaps. It is important is to select the process(es) which have the greatest impact on a competitive advantage or customer requirement.
2. Develop the objective(s) for the project based on the requirements of the process: The focus might be on quality improvement, productivity, cost, customer service or cycle time. The goal is however always the same; to get the key process under control.
3. Select the members of the cross-functional team: A horizontal (cross-functional) analysis is carried out by a team composed of representatives of all functions involved in the process. While a consultant or in-house staff person can do the job, the quality of the analysis and the commitment to change is far greater with a cross-functional team.
4. Document the current process by creating a flowchart or "organization map": Describe the process regarding the Organizational level, the Process level and the Job/ Performer level according to Rummler. Develop a cross-functional process map for the process.
5. Identify "disconnects" in the process: “Disconnections” are everything that inhibit the efficiency and effectiveness of the process. The identification should be categorized into the three levels: The Organizational level, the Process level and the Job/ Performer level.
6. Recommend changes (organizational, in the process or in its execution): Categorize and prioritize the main problems and possibilities, evaluate alternative solutions. Develop a cross-functional process map for the recommended process.
7. Establish process and sub-process measures: The process measures should reflect the objectives of the project.
8. Implement the improvements." [Business process improvement. Wikipedia]
The opportunity flow chart example "Replacing engine oil" was created using the ConceptDraw PRO diagramming and vector drawing software extended with the Cross-Functional Flowcharts solution from the Business Processes area of ConceptDraw Solution Park.
Opportunity flowchart

"Opportunity flowcharts are a variation of detailed basic flowcharts. They get their name because they highlight opportunities for improvement. Like all flowcharts, they make the process visible. But they take this idea one step further by separating value-added steps (those essential for making the product or service) from cost-added-only steps (those that are included only to check for or fix problems). ...
An opportunity flowchart is created by rearranging a detailed basic flowchart. The steps needed if everything works perfectly should flow down the left side of the chart. Steps that exist because of problems and inefficiencies flow across the right side." [Flowcharts: Plain & Simple. Inc Staff Joiner Assocs. 1995. P. 60.]
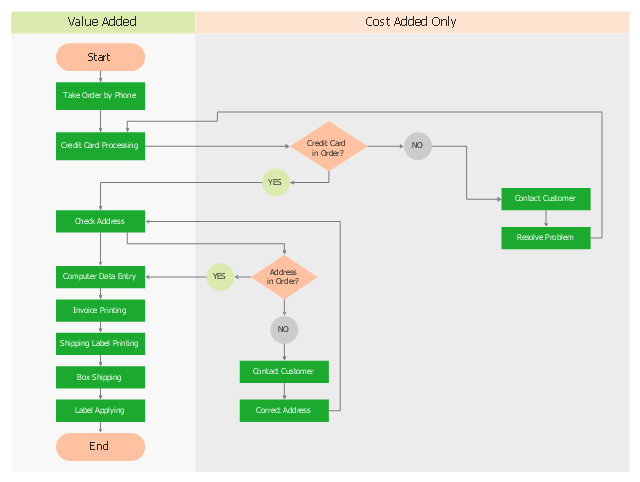
The opportunity flow chart example "Order processing" was created using the ConceptDraw PRO diagramming and vector drawing software extended with the Cross-Functional Flowcharts solution from the Business Processes area of ConceptDraw Solution Park.
An opportunity flowchart is created by rearranging a detailed basic flowchart. The steps needed if everything works perfectly should flow down the left side of the chart. Steps that exist because of problems and inefficiencies flow across the right side." [Flowcharts: Plain & Simple. Inc Staff Joiner Assocs. 1995. P. 60.]
The opportunity flow chart example "Order processing" was created using the ConceptDraw PRO diagramming and vector drawing software extended with the Cross-Functional Flowcharts solution from the Business Processes area of ConceptDraw Solution Park.
Opportunity flowchart
Basic Flowchart Examples

How to Create a Cross Functional Flow Chart

Cross Functional Flowchart for Business Process Mapping

 Cross-Functional Flowcharts
Cross-functional flowcharts are powerful and useful tool for visualizing and analyzing complex business processes which requires involvement of multiple people, teams or even departments. They let clearly represent a sequence of the process steps, the order of operations, relationships between processes and responsible functional units (such as departments or positions).
 Business Processes
Business Process solution extends ConceptDraw PRO software with business process diagrams as cross-functional flowcharts, workflows, process charts, IDEF0, timelines, calendars, Gantt charts, business process modeling, audit and opportunity flowcharts.
Business diagrams & Org Charts with ConceptDraw PRO


Vertical Cross Functional Flowchart

Cross Functional Flowchart

What is a Cross Functional Flow Chart?

Social Media Response Management DFD Charts - software tools


Examples of Flowchart


Basic Flowchart Symbols and Meaning


- Replacing engine oil - Opportunity flowchart | Opportunity flowchart ...
- Basic Flowchart Examples | Replacing engine oil - Opportunity ...
- Replacing engine oil - Opportunity flowchart | Basic Flowchart ...
- What Is Opportunity Flow Diagram
- Lead to opportunity sales flow | Replacing engine oil - Opportunity ...
- Replacing engine oil - Opportunity flowchart
- Order processing - Opportunity flowchart
- Opportunity flowchart - Template
- Replacing engine oil - Opportunity flowchart | Cross-Functional ...
- Replacing engine oil - Opportunity flowchart | Replacing engine oil ...
- Replacing engine oil - Opportunity flowchart | Pyramid Diagram ...
- Replacing engine oil - Opportunity flowchart | Activity Network ...
- Replacing engine oil - Opportunity flowchart | Flow Chart For ...
- Replacing engine oil - Opportunity flowchart | Basic Flowchart ...
- Replacing engine oil - Opportunity flowchart | Cross Functional ...
- Process Flowchart | Replacing engine oil - Opportunity flowchart ...
- Hiring Process | Recruitment | Replacing engine oil - Opportunity ...
- Replacing engine oil - Opportunity flowchart | How to Create a ...
- Replacing engine oil - Opportunity flowchart | Event-driven Process ...
- Replacing engine oil - Opportunity flowchart | Workflow Diagram ...