"Business process improvement (BPI) is a systematic approach to help an organization optimize its underlying processes to achieve more efficient results. ...
An organization is only as good as its processes. To be able to make the necessary changes in an organization, one needs to understand the key processes of the company. Rummler and Brache suggested a model for running a Process Improvement and Management project (PI&M), containing the following steps:
1. Identify the process to be improved (based on a critical business issue): The identification of key processes can be a formal or informal exercise. The management team might select processes by applying a set of criteria derived from strategic and tactical priorities, or process selection is based on obvious performance gaps. It is important is to select the process(es) which have the greatest impact on a competitive advantage or customer requirement.
2. Develop the objective(s) for the project based on the requirements of the process: The focus might be on quality improvement, productivity, cost, customer service or cycle time. The goal is however always the same; to get the key process under control.
3. Select the members of the cross-functional team: A horizontal (cross-functional) analysis is carried out by a team composed of representatives of all functions involved in the process. While a consultant or in-house staff person can do the job, the quality of the analysis and the commitment to change is far greater with a cross-functional team.
4. Document the current process by creating a flowchart or "organization map": Describe the process regarding the Organizational level, the Process level and the Job/ Performer level according to Rummler. Develop a cross-functional process map for the process.
5. Identify "disconnects" in the process: “Disconnections” are everything that inhibit the efficiency and effectiveness of the process. The identification should be categorized into the three levels: The Organizational level, the Process level and the Job/ Performer level.
6. Recommend changes (organizational, in the process or in its execution): Categorize and prioritize the main problems and possibilities, evaluate alternative solutions. Develop a cross-functional process map for the recommended process.
7. Establish process and sub-process measures: The process measures should reflect the objectives of the project.
8. Implement the improvements." [Business process improvement. Wikipedia]
The opportunity flow chart example "Replacing engine oil" was created using the ConceptDraw PRO diagramming and vector drawing software extended with the Cross-Functional Flowcharts solution from the Business Processes area of ConceptDraw Solution Park.
Opportunity flowchart

Activity Network (PERT) Chart

This diagram is constructed as part of the process in creating a schedule of corrective actions. The Activity Network Chart (PERT) shows the logical connections and consequence of tasks to be performed. It displays the time period for problem solving and the implementation of all activities through the critical path.
How to Prepare Learning Presentations for Training

McKinsey 7S framework: Visual representation of the model.
"The McKinsey 7S Framework is a management model developed by well-known business consultants Robert H. Waterman, Jr. and Tom Peters ... in the 1980s. This was a strategic vision for groups, to include businesses, business units, and teams. The 7S are structure, strategy, systems, skills, style, staff and shared values.
The model is most often used as a tool to assess and monitor changes in the internal situation of an organization.
The model is based on the theory that, for an organization to perform well, these seven elements need to be aligned and mutually reinforcing. So, the model can be used to help identify what needs to be realigned to improve performance, or to maintain alignment (and performance) during other types of change." [McKinsey 7S Framework. Wikipedia]
This bubble diagram example was redesigned from the Wikimedia Commons file: McKinsey 7S framework.svg.
[commons.wikimedia.org/ wiki/ File:McKinsey_ 7S_ framework.svg]
This file is licensed under the Creative Commons Attribution-Share Alike 3.0 Unported license. [creativecommons.org/ licenses/ by-sa/ 3.0/ deed.en]
The bubble diagram example "McKinsey 7S framework" was created using the ConceptDraw PRO diagramming and vector drawing software extended with the Bubble Diagrams solution from the area "What is a Diagram" of ConceptDraw Solution Park.
Bubble diagram

eLearning for Leadership


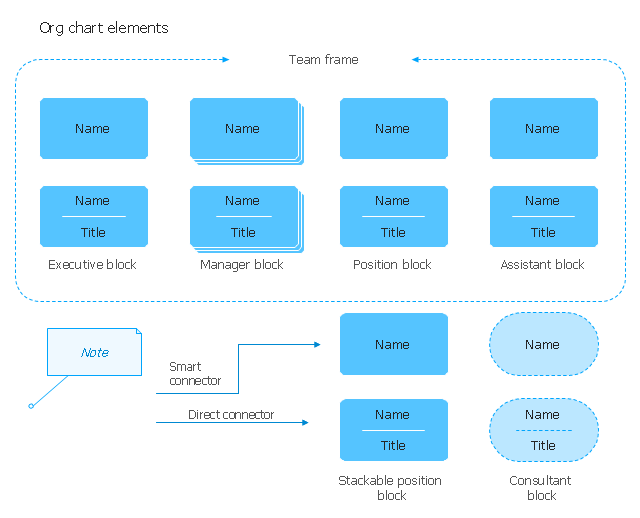
The vector stencils library "Organizational chart" contains 17 symbols for drawing organizational charts using the ConceptDraw PRO diagramming and vector drawing software.
"An organizational chart (often called organization chart, org chart, organigram(me), or organogram(me)) is a diagram that shows the structure of an organization and the relationships and relative ranks of its parts and positions/ jobs. The term is also used for similar diagrams, for example ones showing the different elements of a field of knowledge or a group of languages." [Organizational chart. Wikipedia]
The example "Design elements - Organizational chart" is included in the Organizational Charts solution from the Management area of ConceptDraw Solution Park.
Organizational chart elements
- Small business consultancy SWOT analysis matrix | SWOT analysis ...
- Simple & Fast Diagram Software | Management Tools — Total ...
- Boston growth-share matrix template
- Linux Audit Flowchart Example. Flowchart Examples | Basic Audit ...
- Cross-Functional Flowchart (Swim Lanes) | Swim Lanes Flowchart ...
- Process Flowchart | Cross-functional flowchart - Providing telecom ...
- Opportunity flowchart - Replacing engine oil | Sales Process ...
- Process Flowchart
- Offensive Play – Double Wing Wedge – Vector Graphic Diagram ...
- Cross-Functional Flowcharts | How to Simplify Flow Charting ...
- Bubble diagram - Employer objectives | How to Create a Bubble ...
- How To use Architect Software | Diagramming software for Amazon ...
- Flowchart Programming Project. Flowchart Examples | Examples of ...
- Venn diagram - Internet marketing professions | Vector clipart ...
- How to Draw a Flowchart | Basic Flowchart Symbols | Opportunity ...
- Cross-Functional Flowcharts | Accounting Flowcharts | Process ...
- Process decision program chart (PDPC) - Personal activity | Process ...
- Cross-Functional Process Map Template | Cross-Functional ...
- Cross-Functional Flowchart
- Flowchart Software | Simple Flow Chart. Flowchart Examples ...