Venn Diagram Examples for Problem Solving. Environmental Social Science. Human Sustainability Confluence

Interactive Venn Diagram
Simple Drawing Applications for Mac

Venn Diagram Maker

Venn Diagrams

Flowchart Example: Flow Chart of Marketing Analysis

Bar Diagrams for Problem Solving. Create manufacturing and economics bar charts with Bar Graphs Solution

Workflow Diagram

Data structure diagram with ConceptDraw DIAGRAM

Relative Value Chart Software

This Venn diagram sample depicts the path to sustainable development.
"Sustainable development is an organizing principle for human life on a finite planet. It posits a desirable future state for human societies in which living conditions and resource-use meet human needs without undermining the sustainability of natural systems and the environment, so that future generations may also have their needs met.
Sustainable development ties together concern for the carrying capacity of natural systems with the social and economic challenges faced by humanity. As early as the 1970s, 'sustainability' was employed to describe an economy "in equilibrium with basic ecological support systems." Scientists in many fields have highlighted The Limits to Growth, and economists have presented alternatives, for example a 'steady state economy', to address concerns over the impacts of expanding human development on the planet." [Sustainable development. Wikipedia]
The Venn diagram example "Path to sustainable development" was created using the ConceptDraw PRO diagramming and vector drawing software extended with the Venn Diagrams solution from the area "What is a Diagram" of ConceptDraw Solution Park.
Venn diagram

Bar Graph

Human Resource Management

3 Circle Venn Diagram. Venn Diagram Example

 Venn Diagrams
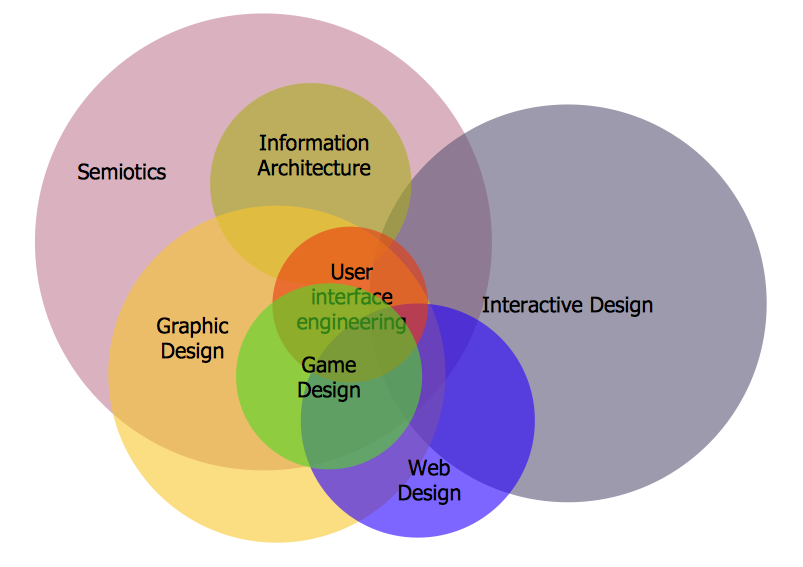
Venn Diagrams are actively used to illustrate simple set relationships in set theory and probability theory, logic and statistics, mathematics and computer science, linguistics, sociology, and marketing. Venn Diagrams are also often used to visually summarize the status and future viability of a project.
- Venn diagram - Path to sustainable development | Venn Diagram ...
- Venn Diagram Examples for Problem Solving. Environmental Social ...
- Marketing | Competitor Analysis | Venn Diagram Examples for ...
- Simple Drawing Applications for Mac | Venn Diagram Examples for ...
- Map Or Drawing And Diagram Of Environment
- Venn Diagram Examples for Problem Solving. Venn Diagram as a ...
- SWOT Analysis | Venn Diagram Examples for Problem Solving ...
- Types of Flowcharts | Process Flowchart | Venn Diagram Examples ...
- Venn Diagram Example
- Environment Diagrams
- Social strategy - Pyramid diagram | Venn Diagram Examples for ...
- Process Flowchart | Human Resource Development | Venn Diagram ...
- Venn diagram - Path to sustainable development | Sustainable ...
- Human Resource Development | Venn Diagram Examples for ...
- Venn Diagrams | Venn Diagram | How to Create a Venn Diagram in ...
- Venn Diagram | Venn Diagram Examples for Problem Solving ...
- Venn Diagrams | Pyramid Chart Examples | Venn Diagram ...
- Example Mind Map Of Marketing Environment
- Draw A Flowchart Of Component Of Environment With Picture
- Venn Diagram | Venn Diagram Maker | Venn Diagram Examples for ...