Venn Diagram

 Venn Diagrams
Venn Diagrams are actively used to illustrate simple set relationships in set theory and probability theory, logic and statistics, mathematics and computer science, linguistics, sociology, and marketing. Venn Diagrams are also often used to visually summarize the status and future viability of a project.
Venn Diagram Examples for Problem Solving. Environmental Social Science. Human Sustainability Confluence

Venn Diagram Examples for Problem Solving. Computer Science. Chomsky Hierarchy

Venn Diagram Examples for Problem Solving. Venn Diagram as a Truth Table

2 Circle Venn Diagram. Venn Diagram Example

Multi Layer Venn Diagram. Venn Diagram Example

Venn Diagram Examples for Problem Solving

HelpDesk
How to Create a Venn Diagram

Basic Circles Venn Diagram. Venn Diagram Example

Circles Venn Diagram

This Venn diagram sample depicts the path to sustainable development.
"Sustainable development is an organizing principle for human life on a finite planet. It posits a desirable future state for human societies in which living conditions and resource-use meet human needs without undermining the sustainability of natural systems and the environment, so that future generations may also have their needs met.
Sustainable development ties together concern for the carrying capacity of natural systems with the social and economic challenges faced by humanity. As early as the 1970s, 'sustainability' was employed to describe an economy "in equilibrium with basic ecological support systems." Scientists in many fields have highlighted The Limits to Growth, and economists have presented alternatives, for example a 'steady state economy', to address concerns over the impacts of expanding human development on the planet." [Sustainable development. Wikipedia]
The Venn diagram example "Path to sustainable development" was created using the ConceptDraw PRO diagramming and vector drawing software extended with the Venn Diagrams solution from the area "What is a Diagram" of ConceptDraw Solution Park.
Venn diagram

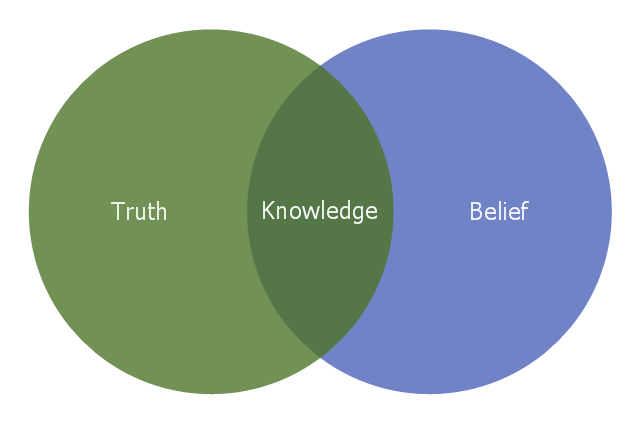
This Venn diagram sample illustrates the Plato's definition of knowledge. It was designed on the base of the Wikimedia Commons file: Belief Venn diagram.svg. [commons.wikimedia.org/ wiki/ File:Belief_ Venn_ diagram.svg]
"Justified true belief is a definition of knowledge that is most frequently credited to Plato and his dialogues. The concept of justified true belief states that in order to know that a given proposition is true, one must not only believe the relevant true proposition, but one must also have justification for doing so. In more formal terms, a subject S knows that a proposition P is true if and only if:
(1) P is true,
(2) S believes that P is true, and
(3) S is justified in believing that P is true" [Justified true belief. Wikipedia]
The Venn diagram example "Knowledge" was created using the ConceptDraw PRO diagramming and vector drawing software extended with the Venn Diagrams solution from the area "What is a Diagram" of ConceptDraw Solution Park.
Venn diagram
Cylinder Venn Diagram

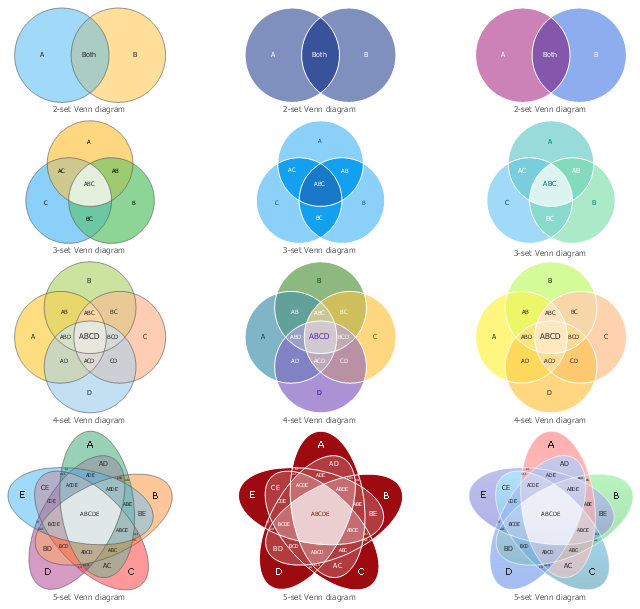
The vector stencils library "Venn diagrams" contains 12 templates. Use it for drawing Venn and Euler diagrams.
"A Venn diagram (also called a set diagram or logic diagram) is a diagram that shows all possible logical relations between a finite collection of different sets. Typically overlapping shapes, usually circles, are used, and an area-proportional or scaled Venn diagram is one in which the area of the shape is proportional to the number of elements it contains. These diagrams represent elements as points in the plane, and sets as regions inside curves. An element is in a set S just in case the corresponding point is in the region for S. They are thus a special case of Euler diagrams, which do not necessarily show all relations. Venn diagrams were conceived around 1880 by John Venn. They are used to teach elementary set theory, as well as illustrate simple set relationships in probability, logic, statistics, linguistics and computer science." [Venn diagram. Wikipedia]
The templates example "Design elements - Venn diagrams" was created using the ConceptDraw PRO diagramming and vector drawing software extended with the Venn Diagrams solution from the area "What is a Diagram" of ConceptDraw Solution Park.
Venn diagram templates
Examples of Flowcharts, Org Charts and More


 ConceptDraw Solution Park
ConceptDraw Solution Park collects graphic extensions, examples and learning materials
Business diagrams & Org Charts with ConceptDraw DIAGRAM


 Basic Diagramming
This solution extends ConceptDraw DIAGRAM software with the specific tools you need to easily draw flowcharts, block diagrams, histograms, pie charts, divided bar diagrams, line graphs, circular arrows diagrams, Venn diagrams, bubble diagrams and concept maps
 Workflow Diagrams
Workflow Diagrams solution extends ConceptDraw DIAGRAM software with samples, templates and vector stencils library for drawing the work process flowcharts.
- Design elements - Venn diagrams | Circles Venn Diagram | Multi ...
- Circles Venn Diagram
- Venn Diagrams | Venn Diagram | 5-Set Venn diagram - Template ...
- Venn Diagram Examples for Problem Solving . Environmental Social ...
- 3 Circle Venn Diagram . Venn Diagram Example
- Venn Diagram Examples for Problem Solving . Venn Diagram as a ...
- Venn Diagram Examples for Problem Solving . Quantum Information ...
- Basic Circles Venn Diagram . Venn Diagram Example | ORM ...
- Venn Diagram Examples for Problem Solving . Computer Science ...
- Basic Circles Venn Diagram . Venn Diagram Example | Multi Layer ...
- Venn diagrams with ConceptDraw PRO | Venn Diagrams | 5-Set ...
- Venn diagram - Relationship marketing | Venn Diagrams | Ladder of ...
- Venn diagrams with ConceptDraw PRO | Basic Circles Venn ...
- 5-Set Venn diagram - Template | Venn Diagram | Multi Layer Venn ...
- Account Flowchart. Flowchart Examples | Venn Diagram Examples ...
- Venn diagrams with ConceptDraw PRO | Venn Diagram Template ...
- Entity-Relationship Diagram (ERD) | Multi Layer Venn Diagram ...
- 3 Circle Venn Diagram . Venn Diagram Example
- 3-Set Venn diagram template
- Venn diagram - Path to sustainable development | Venn Diagram ...