This site uses cookies. By continuing to browse the ConceptDraw site you are agreeing to our Use of Site Cookies.

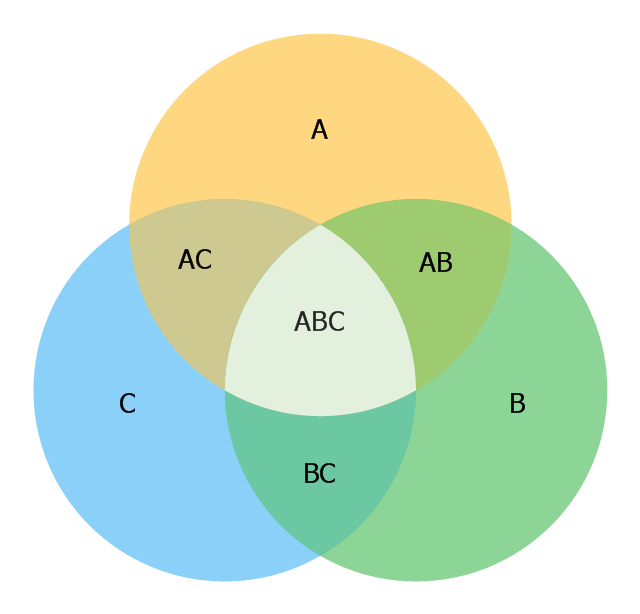
3 Circle Venn Diagram. Venn Diagram Example

This template shows the Venn Diagram. It was created in ConceptDraw DIAGRAM diagramming and vector drawing software using the ready-to-use objects from the Venn Diagrams Solution from the "Diagrams" area of ConceptDraw Solution Park.
Venn Diagrams visualize all possible logical intersections between several sets and are widely used in mathematics, logic, statistics, marketing, sociology, etc.

3 Circle Venn. Venn Diagram Example

This example shows the 3 Circle Venn Diagram. The Venn Diagrams visualize all possible logical intersections between several sets. On this example you can see the intersections of 3 sets. Venn Diagrams are widely used in mathematics, logic, statistics, marketing, sociology, etc.

2 Circle Venn Diagram. Venn Diagram Example

Using the ready-to-use predesigned objects, samples and templates from the Venn Diagrams Solution for ConceptDraw DIAGRAM you can create your own professional looking Venn Diagrams quick and easy.

Cylinder Venn Diagram

You need design Cylinder Venn Diagram? Nothing could be easier with ConceptDraw DIAGRAM diagramming and vector drawing software extended with Venn Diagrams Solution from the “Diagrams” Area. ConceptDraw DIAGRAM allows you to design various Venn Diagrams including Cylinder Venn Diagrams.

Venn Diagram Template

It's impossible to overestimate the usefulness and convenience of using the ready templates when you create your own diagrams and charts. And Venn Diagrams are not exception. ConceptDraw DIAGRAM diagramming and vector drawing software presents the Venn Diagrams solution from "Diagrams" area which offers a set of Venn Diagram templates and samples. Use the suitable Venn Diagram Template to create your own Venn Diagram of any complexity.

Venn Diagram

Venn diagrams are illustrations used in the branch of mathematics known as set theory. They show the mathematical or logical relationship between different groups of things (sets). A Venn diagram shows all the possible logical relations between the sets.

Circles Venn Diagram

This example shows the 4 Circle Venn Diagram. The Venn Diagram visualizes all possible logical relations between several sets. The sets are represented as circles on the Venn Diagram. On this example you can see the intersections of 4 sets. Venn Diagrams are widely used in mathematics, logic, statistics, marketing, sociology, etc.

Circle Spoke Diagram Template

ConceptDraw DIAGRAM diagramming and vector drawing software offers the Circle Spoke Diagram Template included in the Circle-Spoke Diagrams Solution from the "Diagrams" Area. Use of ready template is the easiest way of drawing professional looking Circle-Spoke Diagrams.

Interactive Venn Diagram

Venn Diagrams Solution offers you the Venn Diagrams library of ready-to-use vector objects and large collection of templates and samples allowing you create your own Interactive Venn Diagram in minutes.
Venn Diagrams designed in ConceptDraw DIAGRAM are visual, bright, colorful, so they can be successfully used in different reports, appearances on the conferences, meetings.

Venn Diagram Examples for Problem Solving. Computer Science. Chomsky Hierarchy

A Venn diagram, sometimes referred to as a set diagram, is a diagramming style used to show all the possible logical relations between a finite amount of sets. In mathematical terms, a set is a collection of distinct objects gathered together into a group, which can then itself be termed as a single object. Venn diagrams represent these objects on a page as circles or ellipses, and their placement in relation to each other describes the relationships between them.
The Venn diagram example below visualizes the the class of language inclusions described by the Chomsky hierarchy.

What Is a Circle Spoke Diagram

What Is a Circle Spoke Diagram? It is a diagram which have a central item surrounded by other items in a circle. The Circle Spoke Diagrams are often used to show the features or components of the central item in marketing and management documents and presentations. ConceptDraw DIAGRAM extended with Circle-Spoke Diagrams Solution from the "Diagrams" Area is the best software for creating Circle-Spoke Diagrams.
Use this template to design your three-set Venn diagrams.
"Definition of VENN DIAGRAM: a graph that employs closed curves and especially circles to represent logical relations between and operations on sets and the terms of propositions by the inclusion, exclusion, or intersection of the curves" [merriam-webster.com/ dictionary/ venn%20 diagram]
The template "3-set Venn diagram" is included in the Venn diagrams solution from the area "What is a Diagram" of ConceptDraw Solution Park.
Venn diagram
Venn diagram, Venn diagram,

Circle Diagrams

The Circle Diagrams are the diagrams which represent the central element surrounded by other items in a circle. This type of diagram is very popular and widely used in marketing and management, for process modeling, market, resource, time and cost analysis, for visualization causes and effects. If you dream to design the Circle Diagrams quick and easy – the ConceptDraw DIAGRAM software extended with Circle-Spoke Diagrams Solution from the "Diagrams" Area is exactly what you need.

Venn Diagram Examples for Problem Solving. Environmental Social Science. Human Sustainability Confluence

The Venn diagram example below shows sustainable development at the confluence of three constituent parts.
Create your Venn diagrams for problem solving in environmental social science using the ConceptDraw DIAGRAM diagramming and vector drawing software extended with the Venn Diagrams solution from the area "Diagrams" of ConceptDraw Solution Park.

Venn Diagram Examples for Problem Solving. Venn Diagram as a Truth Table

Venn diagrams are illustrations used in the branch of mathematics known as set theory. They show the mathematical or logical relationship between different groups of things (sets). A Venn diagram shows all the possible logical relations between the sets.

Making Mechanical Diagram

The engineering diagrams produced with ConceptDraw DIAGRAM are vector graphic documents and are available for reviewing, modifying, and converting to a variety of formats (image, HTML, PDF file, MS PowerPoint Presentation, Adobe Flash or MS Visio XML).
The vector stencils library "Circular diagrams" contains 42 templates of circular diagrams: circular arrow diagram, circular motion diagram, arrow ring chart, doughnut chart (donut chart), circle pie chart, diamond pie chart, circle diagram, pie chart, ring chart, loop diagram, block loop diagram, arrow loop circle, crystal diagram, triangular diagram, diamond diagram, pentagon diagram, hexagon diagram, heptagon diagram, cycle diagram (cycle chart), stacked Venn diagram (onion diagram), arrow circle diagram.
Use these shapes to illustrate your marketing and sales documents, presentations, webpages and infographics in the ConceptDraw PRO diagramming and vector drawing software extended with the Target and Circular Diagrams solution from the Marketing area of ConceptDraw Solution Park.
www.conceptdraw.com/ solution-park/ marketing-target-and-circular-diagrams
Circular arrow diagram 1
Circular arrow diagram 1, circular arrow diagram, circular motion diagram,
Circular arrow diagram 2
Circular arrow diagram 2, circular arrow diagram, circular motion diagram,
Arrow ring chart
Arrow ring chart, circular arrow diagram, circular motion diagram,
Doughnut chart
Doughnut chart, doughnut chart, pie chart, ring chart, donut chart,
Diamond pie chart
Diamond pie chart, diamond pie chart, circular diagram,
Pie chart
Pie chart, pie chart,
Circle diagram
Circle diagram, circle diagram, circular diagram,
Circle pie chart 2
Circle pie chart 2, circle pie chart, circular diagram, marketing mix diagram,
Circle pie chart 1
Circle pie chart 1, circle pie chart, circular diagram, marketing mix diagram,
Ring chart 1 - 3 elements
Ring chart 1 - 3 elements, doughnut chart, pie chart, ring chart, donut chart,
Ring chart 1 - 4 elements
Ring chart 1 - 4 elements, doughnut chart, pie chart, ring chart, donut chart,
Ring chart 1 - 5 elements
Ring chart 1 - 5 elements, doughnut chart, pie chart, ring chart, donut chart,
Ring chart 1 - 6 elements
Ring chart 1 - 6 elements, doughnut chart, pie chart, ring chart, donut chart,
Ring chart 1 - 7 elements
Ring chart 1 - 7 elements, doughnut chart, pie chart, ring chart, donut chart,
Ring chart 2 - 3 elements
Ring chart 2 - 3 elements, doughnut chart, pie chart, ring chart, donut chart,
Ring chart 2 - 4 elements
Ring chart 2 - 4 elements, doughnut chart, pie chart, ring chart, donut chart,
Ring chart 2 - 5 elements
Ring chart 2 - 5 elements, doughnut chart, pie chart, ring chart, donut chart,
Ring chart 2 - 6 elements
Ring chart 2 - 6 elements, doughnut chart, pie chart, ring chart, donut chart,
Ring chart 2 - 7 elements
Ring chart 2 - 7 elements, doughnut chart, pie chart, ring chart, donut chart,
Crystal diagram - 3 elements
Crystal diagram - 3 elements, crystal diagram, triangular diagram,
Crystal diagram - 4 elements
Crystal diagram - 4 elements, crystal diagram, diamond diagram,
Crystal diagram - 5 elements
Crystal diagram - 5 elements, crystal diagram, pentagon diagram,
Crystal diagram - 6 elements
Crystal diagram - 6 elements, crystal diagram, hexagon diagram,
Crystal diagram - 7 elements
Crystal diagram - 7 elements, crystal diagram, heptagon diagram,
Stacked Venn diagram - 4
Stacked Venn diagram - 4, stacked Venn diagram, onion diagram,
Stacked Venn diagram - 5
Stacked Venn diagram - 5, stacked Venn diagram, onion diagram,
Stacked Venn diagram - 6
Stacked Venn diagram - 6, stacked Venn diagram, onion diagram,
Stacked Venn diagram - 7
Stacked Venn diagram - 7, stacked Venn diagram, onion diagram,
Basic loop diagram
Basic loop diagram, basic loop diagram,
Block loop diagram
Block loop diagram, block loop diagram,
Arrow loop circle
Arrow loop circle, arrow loop circle,
Arrow loop - 3 circles
Arrow loop - 3 circles, arrow loop diagram,
Arrow loop - 4 circles
Arrow loop - 4 circles, arrow loop diagram,
Arrow loop - 5 circles
Arrow loop - 5 circles, arrow loop diagram,
Arrow loop - 6 circles
Arrow loop - 6 circles, arrow loop diagram,
Arrow loop - 7 circles
Arrow loop - 7 circles, arrow loop diagram,
Arrow circle diagram - 3
Arrow circle diagram - 3, arrow circle diagram,
Arrow circle diagram - 4
Arrow circle diagram - 4, arrow circle diagram,
Stacked Venn diagram - 3
Stacked Venn diagram - 3, stacked Venn diagram, onion diagram,
Arrow circle diagram - 5
Arrow circle diagram - 5, arrow circle diagram,
Arrow circle diagram - 6
Arrow circle diagram - 6, arrow circle diagram,
Arrow circle diagram - 7
Arrow circle diagram - 7, arrow circle diagram,

Venn Diagram Template for Word

This template shows the Venn Diagram. It was created in ConceptDraw DIAGRAM diagramming and vector drawing software using the ready-to-use objects from the Venn Diagrams Solution from the "Diagrams" area of ConceptDraw Solution Park.

Basic Audit Flowchart. Flowchart Examples

This sample shows the Audit Process Flowchart. It was created in ConceptDraw DIAGRAM diagramming and vector drawing software using the Flowcharts solution from the Diagrams area of ConceptDraw Solution Park.
The Audit Flowcharts are widely used in the financial management, accounting, money management and in many others fields.

Hierarchical Network Topology

This sample was created in ConceptDraw DIAGRAM diagramming and vector drawing software using the Computer and Networks solution from Computer and Networks area of ConceptDraw Solution Park.
This sample shows the Hierarchical network topology.
A Hierarchical network topology interconnects multiple groups that are located on the separate layers to form a larger network. Each layer concentrates on the specified functions, this allows to choose the right equipment for the layer.