PROBLEM ANALYSIS. Root Cause Analysis Tree Diagram
Root Cause Analysis Tree Diagram. Use the Root Cause Diagram to perform visual root cause analysis. Root Cause Analysis Tree Diagram is constructed separately for each highly prioritized factor. The goal of this is to find the root causes for the factor and list possible corrective action. ConceptDraw Office suite is a software for problem analysis.
Using Fishbone Diagrams for Problem Solving
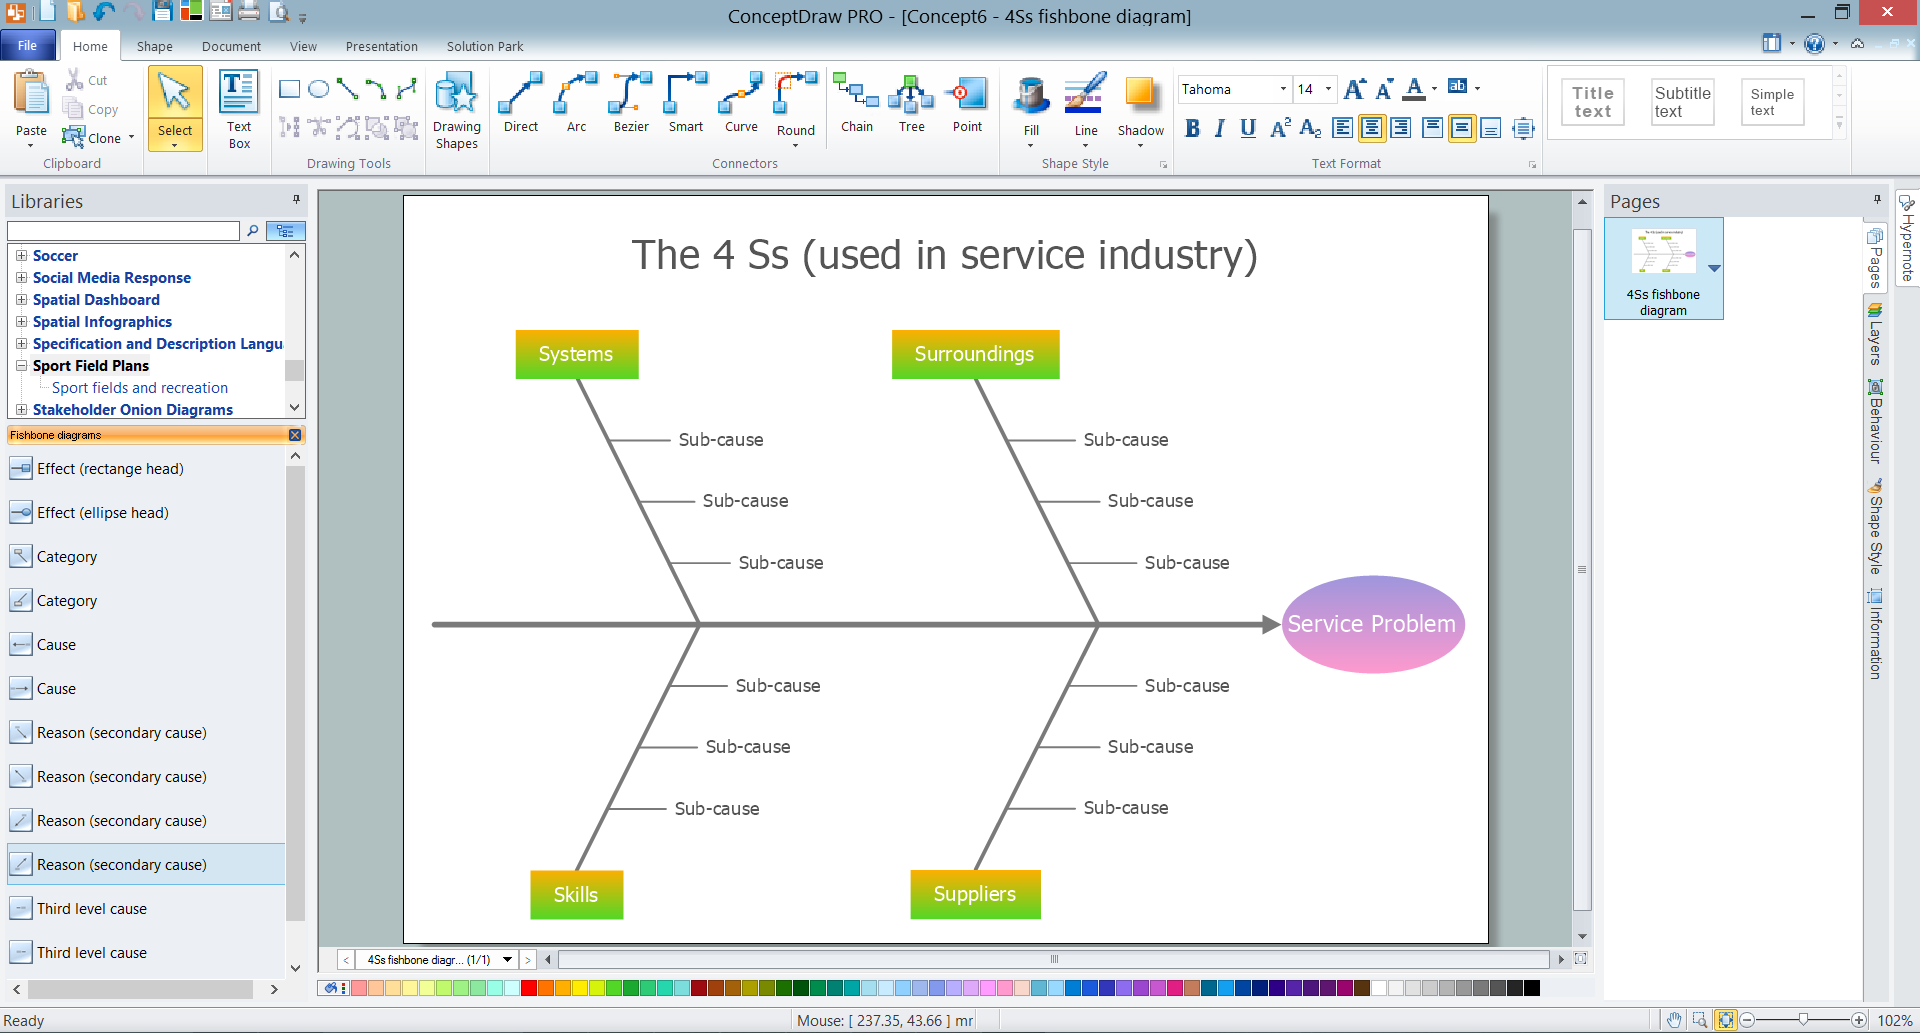
Problems are obstacles and challenges that one should overcome to reach the goal. They are an inseparable part of any business, and the success of an enterprise often depends on ability to solve all problems effectively. The process of problem solving often uses rational approach, helping to find a suitable solution. Using Fishbone Diagrams for Problem Solving is a productive and illustrative tool to identify the most important factors causing the trouble. ConceptDraw DIAGRAM extended with Fishbone Diagrams solution from the Management area of ConceptDraw Solution Park is a powerful tool for problem solving with Fishbone Ishikawa diagram graphic method.TQM Diagram Tool
The Total Quality Management Diagram solution helps you and your organization visualize business and industrial processes. Create Total Quality Management diagrams for business process with ConceptDraw software.Project —Task Trees and Dependencies
Users new to ConceptDraw PROJECT will find the Basic lessons an essential platform for familiarizing themselves with the program′s functions. This video lesson will teach you how to set up task trees and dependencies.PDPC
ConceptDraw DIAGRAM extended with Seven Management and Planning Tools Solution from the Management Area of ConceptDraw Solution Park is the best software for drawing all types of diagrams from the Seven Management and Planning Tools: Affinity Diagram, Relations Diagram, Prioritization Matrix, Root Cause Analysis Tree Diagram, Involvement Matrix, PERT Chart, and Risk Diagram (PDPC).Prioritization Matrix
You can design the Prioritization Matrix by hand on the paper, but we offer you the most easier way - to use the ConceptDraw DIAGRAM diagramming and vector drawing software extended with Seven Management and Planning Tools Solution from the Management Area.Cause and Effect Analysis - Fishbone Diagrams for Problem Solving
Fishbone diagram is a powerful tool used for solving business problems and obstacles. ConceptDraw DIAGRAM software extended with Fishbone Diagrams solution from the Management area of ConceptDraw Solution Park is a helpful tool for cause and effect analysis. It gives the ability to easy identify many possible causes and factors which cause the effects and to draw Fishbone Diagrams for problem solving.Fishbone Diagram Problem Solving
The Ishikawa diagram, Cause and Effect diagram, Fishbone diagram — all they are the names of one and the same visual method for working with causal connections. Originally invented by Kaoru Ishikawa to control the process quality, the Ishikawa diagram is well proven in other fields of management and personal scheduling, events planning, time management. It is a chart in the form of a fish, whose head is a problem, the fins are variants for its causes. To design easily the Fishbone diagram, you can use a special ConceptDraw DIAGRAM ector graphic and diagramming software which contains the powerful tools for Fishbone diagram problem solving offered by Fishbone Diagrams solution for the Management area of ConceptDraw Solution Park.Bar Diagrams for Problem Solving. Create business management bar charts with Bar Graphs Solution
Create bar charts for business management problem solving and data comparison using the ConceptDraw DIAGRAM diagramming and vector drawing software extended with the Bar Graphs Solution from the Graphs and Charts area of ConceptDraw Solition Park.Why People Select ConceptDraw MINDMAP
Why people select ConceptDraw MINDMAP ? Undoubtedly it is the best alternative to MindJet MindManager. Among the advantages of ConceptDraw MINDMAP are: powerful and unique tools for brainstorming, outlining, taking notes, making detailed Mind Maps and relationship maps; the personal license that gives the ownership on the product for the product's life and allows a concurrent Mac and Windows installation; the absence of obligatory subscription on renewal; regularly updates with new features, templates and low upgrade costs; free technical support and better service for a lower cost. Besides, ConceptDraw MINDMAP provides the operating system migration and compatibility with other ConceptDraw products. It is a cross-platform software for the use on Mac and Windows machines simultaneously according to your preferences. The opening of ConceptDraw MINDMAP document in ConceptDraw PROJECT application turns the outline into a project, now you can add resources and due dates, edit the tasks to make a robust and easily-deciphered project. Discover today what these benefits mean to you.Network Topologies
Network topology is a topological structure of computer network, which can be physical or logical. The physical topology depicts location of different computer network elements such as computers, cables and other devices. The logical topology visually displays network dataflows from one device to another. Sometimes network logical and physical topologies can be the same. ConceptDraw DIAGRAM diagramming and vector drawing software is powerful for drawing network maps and network topologies diagrams of any kinds and complexity thanks to the Computer Network Diagrams solution from the Computer and Networks area. ConceptDraw STORE proposes collection of network icons libraries and a lot of Network Topology Diagram examples, samples and templates which were created at ConceptDraw DIAGRAM software specially for Computer Network Diagrams solution. There are six basic types of the network topologies: Bus, Star, Ring, Mesh, Tree, Fully Connected. You can fast and easy design professional-looking diagram for each of them using the ConceptDraw DIAGRAM tools. There are plenty of web Visio-like diagramming software available. Web based diagrams software can be powerful, but sometimes it is essential to have desktop software. One of the most advanced diagrams tools like Visio for Mac OS is ConceptDraw DIAGRAM app.
Fishbone Problem Solving Tool
Fishbone diagram, often reffered as Cause and Effect diagram or Ishikawa diagram, is one of the basic and the most effective tools for problems solving. It is a way of graphical identifying, structuring and exploration the root causes of a problem for determining effective decision. ConceptDraw DIAGRAM enhanced with Fishbone Diagrams solution is a professional fishbone problem solving tool which helps you draw Business Productivity diagram, Cause and Effect, Fishbone, Ishikawa Diagrams to solve problems at your business.Fishbone Diagram Procedure
ConceptDraw DIAGRAM diagramming and vector drawing software enhanced with Fishbone Diagrams solution from the Management area of ConceptDraw Solution Park gives the ability to draw Fishbone diagram, which identifies many possible causes for an effect for problem solving. Fishbone Diagram procedure of creation includes the set of steps easy for execution in ConceptDraw DIAGRAM.Cause and Effect Diagram Software
The Cause and Effect diagram introduced by Kaoru Ishikawa in 1968 is a method for analyzing process dispersion. It can help you to dive into a problem and find an effective solution, identify and represent the possible causes for an effect, analyze the complex business problems and successfully solve them. You can design your Cause and Effect diagram on a paper, but more effective way is to use specific software - ConceptDraw DIAGRAM is a powerful Cause and Effect Diagram Software. It helps you create Cause and Effect diagram known also as Fishbone diagram or Ishikawa diagram from templates and examples.Workflow Diagram
Workflow diagram is a perfect tool to represent visually a repeatable pattern of organizational activity that is powered by resources and to describe in details the transferring of data, documents or tasks during a work process. It effectively explains and documents the process flow that exists and that requires the studying, analyzing and execution. Workflow diagrams help to represent the working processes in a simple visual manner, to follow easy the path of a task in a workflow, to identify the persons responsible for the execution of each stage, to show the accompanied documents and needed resources. All this helps to optimize the workflow and to discover its weak points. Workflow diagrams are mainly designed and used as a part of project documentation, certification process and company policies to comply the standards. To design professionally the Workflow diagrams, use the ConceptDraw DIAGRAM software. Enhanced with Workflow Diagrams solution from the Business Processes area, the ConceptDraw DIAGRAM it is a powerful workflow diagram maker.- Environmental Planning Diagram
- Environmental Planning Using Prioritization Matrix As A Tool
- PROBLEM ANALYSIS. Root Cause Analysis Tree Diagram
- Fault Tree Analysis Diagrams | PROBLEM ANALYSIS. Root Cause ...
- Venn Diagram Examples for Problem Solving. Computer Science ...
- How Interrelationship Diagram Is Used In Environmental Planning
- PROBLEM ANALYSIS. Root Cause Analysis Tree Diagram ...
- PROBLEM ANALYSIS. Root Cause Analysis Tree Diagram ...
- SWOT Analysis | SWOT Matrix | PROBLEM ANALYSIS. Root Cause ...
- Cause and Effect Analysis | PROBLEM ANALYSIS. Identify and ...
- Using Fishbone Diagrams for Problem Solving | PROBLEM ...
- Fishbone Diagram Strategic Planning
- Cause and Effect Analysis | Prioritization Matrix | Fishbone Diagram ...
- Cause And Effect Analysis Example
- Block diagram - Planning process
- PROBLEM ANALYSIS. Prioritization Matrix | 7 Management ...
- Prioritization Matrix | PDPC | PROBLEM ANALYSIS. Root Cause ...
- Root cause analysis tree diagram - Personal problem solution ...
- Fishbone diagram - HAN project | CORRECTIVE ACTIONS ...


