Fault Tree Diagram

Decision Making


Fault Tree Analysis Software

The vector stencils library "Fault tree analysis diagrams" contains 12 symbols for drawing Fault Tree Analysis (FTA) diagrams.
"Fault tree analysis (FTA) is a top down, deductive failure analysis in which an undesired state of a system is analyzed using Boolean logic to combine a series of lower-level events. This analysis method is mainly used in the fields of safety engineering and reliability engineering to understand how systems can fail, to identify the best ways to reduce risk or to determine (or get a feeling for) event rates of a safety accident or a particular system level (functional) failure. FTA is used in the aerospace, nuclear power, chemical and process, pharmaceutical, petrochemical and other high-hazard industries; but is also used in fields as diverse as risk factor identification relating to social service system failure.
In aerospace, the more general term "system Failure Condition" is used for the "undesired state" / Top event of the fault tree. These conditions are classified by the severity of their effects. The most severe conditions require the most extensive fault tree analysis. These "system Failure Conditions" and their classification are often previously determined in the functional Hazard analysis." [Fault tree analysis. Wikipedia]
The shapes example "Fault tree analysis diagrams" was created using the ConceptDraw PRO diagramming and vector drawing software extended with the Fault Tree Analysis Diagrams solution from the Engineering area of ConceptDraw Solution Park.
FTA diagram symbols

The vector stencils library "Fault tree analysis diagrams" contains 12 symbols for drawing FTA diagrams in the ConceptDraw PRO diagramming and vector drawing software extended with the Fault Tree Analysis Diagrams solution from the Engineering area of ConceptDraw Solution Park.
www.conceptdraw.com/ solution-park/ engineering-fault-tree-analysis-diagrams
www.conceptdraw.com/ solution-park/ engineering-fault-tree-analysis-diagrams
AND gate

Priority AND gate

OR gate

Inhibit gate

XOR gate

Event

Basic event

Undeveloped event

House event

Conditional event

Transfer symbol

Voting gate

The vector stencils library "Fault tree analysis diagrams" contains 12 symbols for drawing FTA diagrams in the ConceptDraw PRO diagramming and vector drawing software extended with the Fault Tree Analysis Diagrams solution from the Engineering area of ConceptDraw Solution Park.
www.conceptdraw.com/ solution-park/ engineering-fault-tree-analysis-diagrams
www.conceptdraw.com/ solution-park/ engineering-fault-tree-analysis-diagrams
AND gate
Priority AND gate
OR gate
Inhibit gate
XOR gate
Event
Basic event
Undeveloped event
House event
Conditional event
Transfer symbol
Voting gate
How To Make a Bubble Chart

PDPC

Tree Network Topology Diagram

 Telecommunication Network Diagrams
Telecommunication Network Diagrams solution extends ConceptDraw DIAGRAM software with samples, templates, and great collection of vector stencils to help the specialists in a field of networks and telecommunications, as well as other users to create Computer systems networking and Telecommunication network diagrams for various fields, to organize the work of call centers, to design the GPRS networks and GPS navigational systems, mobile, satellite and hybrid communication networks, to construct the mobile TV networks and wireless broadband networks.
 Interactive Voice Response Diagrams
Interactive Voice Response Diagrams solution extends ConceptDraw DIAGRAM software with samples, templates and libraries of ready-to-use vector stencils that help create Interactive Voice Response (IVR) diagrams illustrating in details a work of interactive voice response system, the IVR system’s logical and physical structure, Voice-over-Internet Protocol (VoIP) diagrams, and Action VoIP diagrams with representing voice actions on them, to visualize how the computers interact with callers through voice recognition and dual-tone multi-frequency signaling (DTMF) keypad inputs.
Context Diagram Template

This template shows the Context Diagram. It was created in ConceptDraw DIAGRAM diagramming and vector drawing software using the Block Diagrams Solution from the “Diagrams” area of ConceptDraw Solution Park. The context diagram graphically identifies the system. external factors, and relations between them. It’s a high level view of the system. The context diagrams are widely used in software engineering and systems engineering for designing the systems that process the information.
Data Flow Diagram

Accounting Flowchart Symbols

DFD Flowchart Symbols

 Wireless Networks
The Wireless Networks Solution extends ConceptDraw DIAGRAM software with professional diagramming tools, set of wireless network diagram templates and samples, comprehensive library of wireless communications and WLAN objects to help network engineers and designers efficiently design and create Wireless network diagrams that illustrate wireless networks of any speed and complexity, and help to identify all required equipment for construction and updating wireless networks, and calculating their costs.
"The ideal telecommunication network has the following characteristics: broadband, multi-media, multi-point, multi-rate and economical implementation for a diversity of services (multi-services). The Broadband Integrated Services Digital Network (B-ISDN) intended to provide these characteristics. Asynchronous Transfer Mode (ATM) was promoted as a target technology for meeting these requirements" [Broadband networks. Wikipedia]
"Wireless broadband is technology that provides high-speed wireless Internet access or computer networking access over a wide area. ...
Wireless networks can feature data rates roughly equivalent to some wired networks, such as that of asymmetric digital subscriber line (ADSL) or a cable modem. Wireless networks can also be symmetrical, meaning the same rate in both directions (downstream and upstream), which is most commonly associated with fixed wireless networks. A fixed wireless network link is a stationary terrestrial wireless connection, which can support higher data rates for the same power as mobile or satellite systems.
Few wireless Internet service providers (WISPs) provide download speeds of over 100 Mbit/ s; most broadband wireless access (BWA) services are estimated to have a range of 50 km (31 mi) from a tower. Technologies used include LMDS and MMDS, as well as heavy use of the ISM bands and one particular access technology was standardized by IEEE 802.16, with products known as WiMAX." [Wireless broadband. Wikipedia]
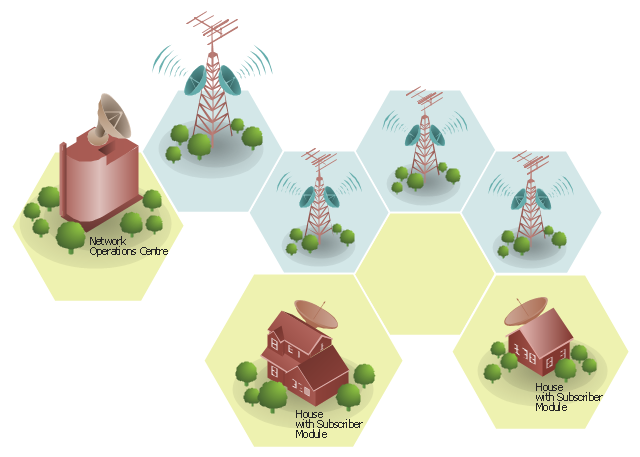
Wireless broadband is technology that provides high-speed wireless Internet access or computer networking access over a wide area. [Wireless broadband. Wikipedia]
This wireless broadband network diagram example was created using the ConceptDraw PRO diagramming and vector drawing software extended with the Telecommunication Network Diagrams solution from the Computer and Networks area of ConceptDraw Solution Park.
"Wireless broadband is technology that provides high-speed wireless Internet access or computer networking access over a wide area. ...
Wireless networks can feature data rates roughly equivalent to some wired networks, such as that of asymmetric digital subscriber line (ADSL) or a cable modem. Wireless networks can also be symmetrical, meaning the same rate in both directions (downstream and upstream), which is most commonly associated with fixed wireless networks. A fixed wireless network link is a stationary terrestrial wireless connection, which can support higher data rates for the same power as mobile or satellite systems.
Few wireless Internet service providers (WISPs) provide download speeds of over 100 Mbit/ s; most broadband wireless access (BWA) services are estimated to have a range of 50 km (31 mi) from a tower. Technologies used include LMDS and MMDS, as well as heavy use of the ISM bands and one particular access technology was standardized by IEEE 802.16, with products known as WiMAX." [Wireless broadband. Wikipedia]
Wireless broadband is technology that provides high-speed wireless Internet access or computer networking access over a wide area. [Wireless broadband. Wikipedia]
This wireless broadband network diagram example was created using the ConceptDraw PRO diagramming and vector drawing software extended with the Telecommunication Network Diagrams solution from the Computer and Networks area of ConceptDraw Solution Park.
Wireless broadband network diagram
Illustrate the Computer Network of a Building

ConceptDraw DIAGRAM The best Business Drawing Software

Garrett IA Diagrams with ConceptDraw DIAGRAM

- Information Transfer Tree Diagram
- Information Transfer Pie Chart Examples
- Information Transfer Tree Diagram With Answer
- Information Transfer Tree Diagram To Paragraph
- ConceptDraw PRO DFD Software | Information Transfer Flow Chart ...
- Information Transfer Of Flow Chart
- Information Transfer Pie Chart Of Food Tree Diagram
- Information Transfer Into Pie Diagram
- Information Transfer Pie Chart Bar Diagrams Flow Charts
- Data Flow Diagram Symbols. DFD Library
- Information Transfer Pie Chart Bar Diagrams Flow Charts
- Network Diagram Examples | Block Diagrams | Entity-Relationship ...
- Data Flow Diagram Symbols. DFD Library
- Paragraph Based On Tree Diagram Chart
- Entity-Relationship Diagram (ERD) | Money Tree Diagram Wikipedia
- Analytical Tree Diagram Of The Computer Classification And Sub ...
- Information Transfer Examples Of Pie Chart
- Informations Transfer Of Pie Chart
- Functional Flow Block Diagram | Spider Chart Template | Transfer Of ...
- Information Transfer Activities Example Pie Charts